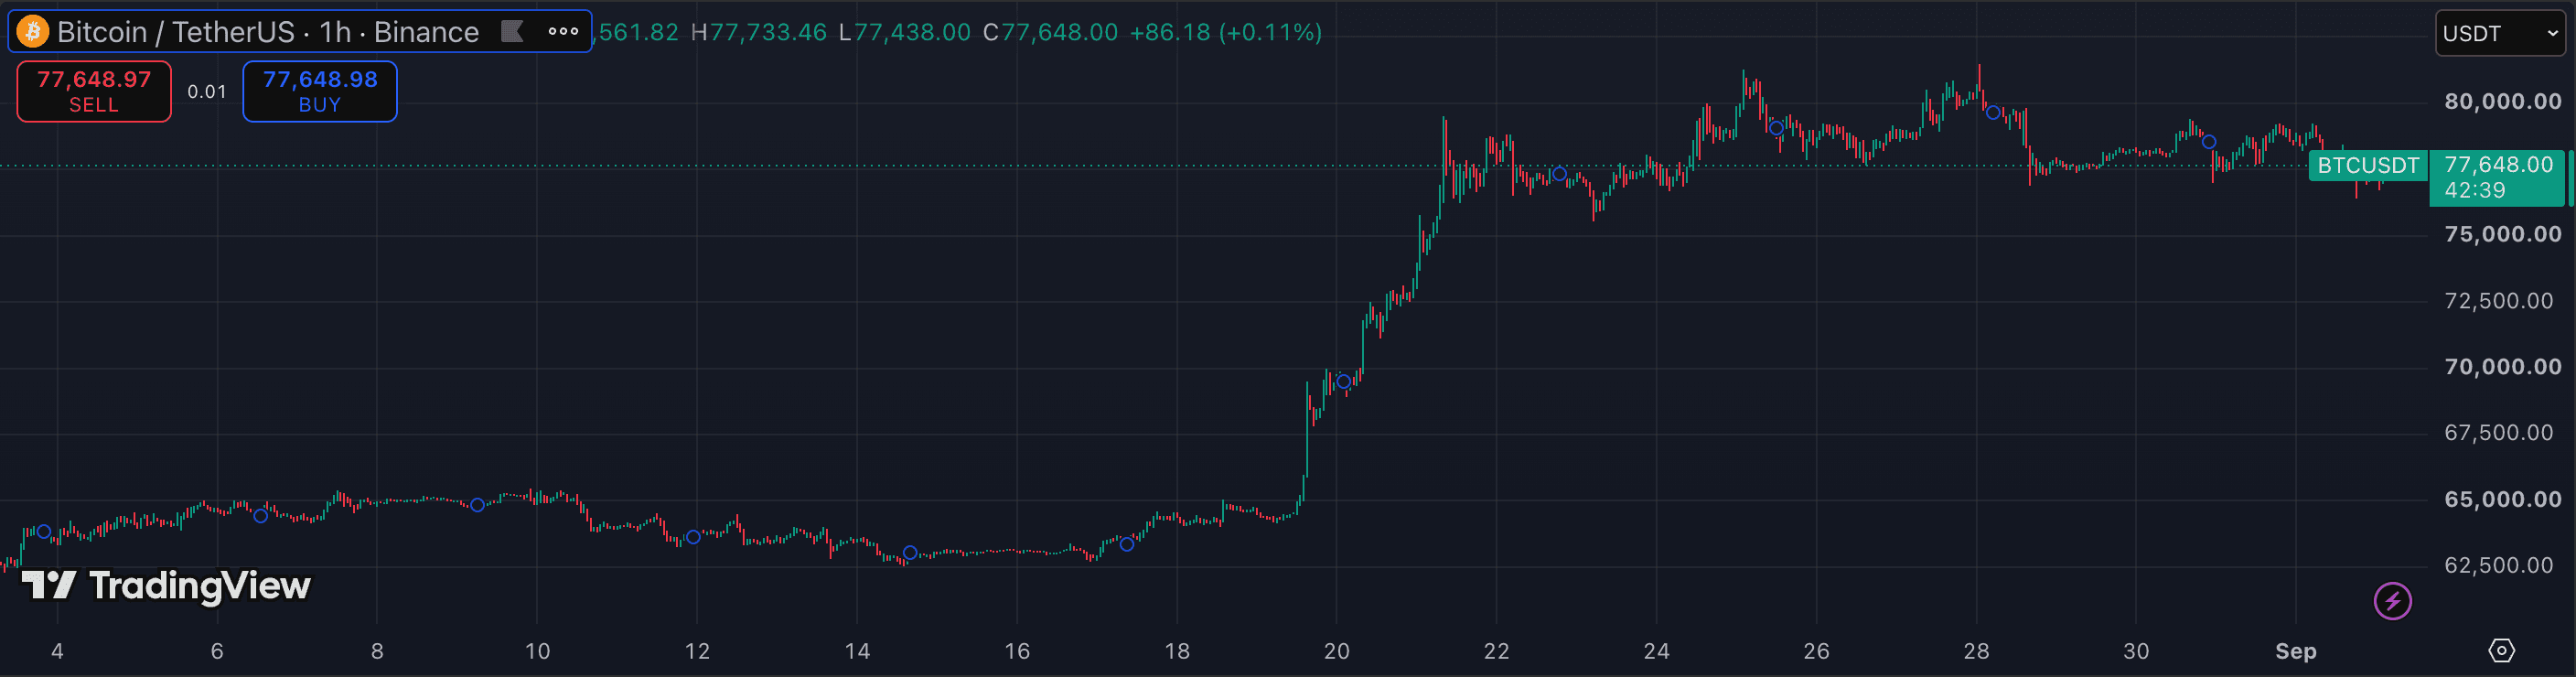
What Regular Candlesticks does, and when it works.
Regular candlesticks display the actual traded prices for each bar: the body spans open to close, the upper wick extends to the bar's high, and the lower wick extends to the bar's low. Every price shown is a real order-book event — what you see is what actually happened in the market.
In crypto, standard candles are the non-negotiable reference for order entry, stop placement, and structure identification. All significant levels — swing highs, swing lows, support and resistance zones, liquidity pockets — are read from real candlestick prices. No averaged or smoothed chart type is a substitute for understanding the raw price structure that standard candles show.
The limitation is noise. In volatile crypto markets, every normal pullback produces red candles in a bull run and every short-term bounce produces green candles in a decline. Holding through a trend requires filtering that noise, which is where smoother chart types like Heikin Ashi or a moving average overlay help.