COMPARISON · UPDATED 2026-06-10
RSIvsStochastic
Two of the oldest oscillators in technical analysis. Both still ship in TradingView's default toolbox. Which one earns the slot on your chart?
— SIDE BY SIDE
The attributes that matter.
| Attribute | RSI | Stochastic |
|---|---|---|
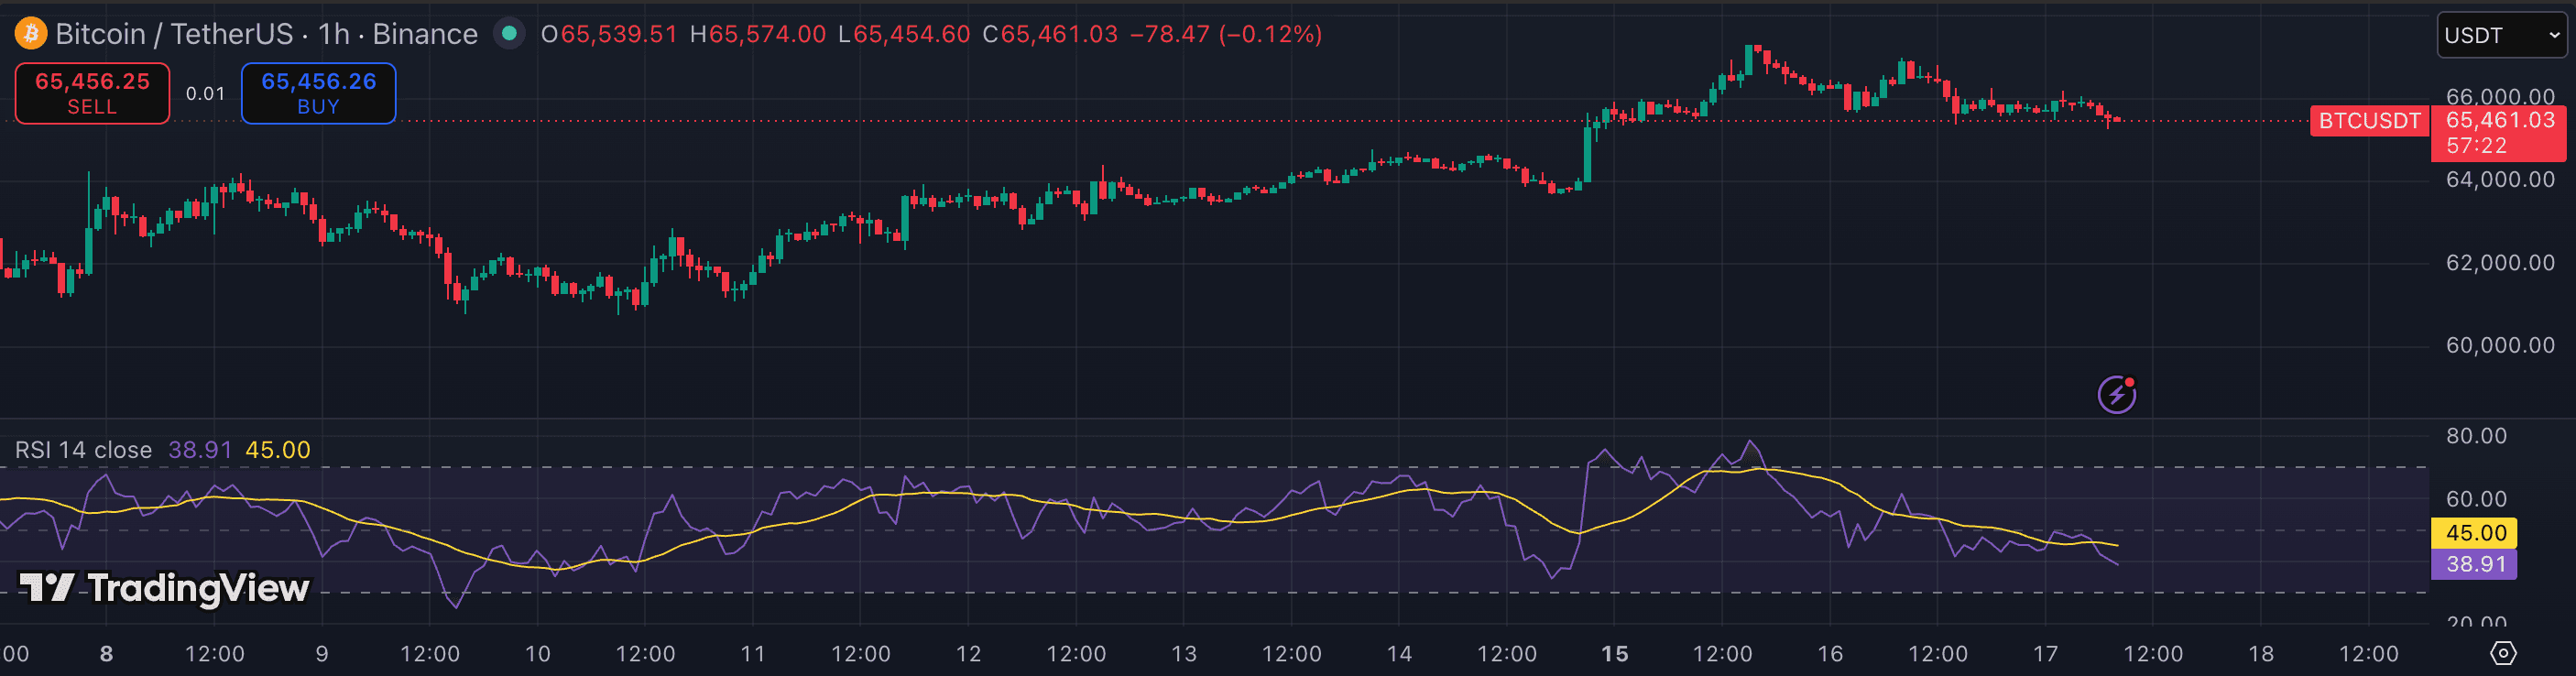
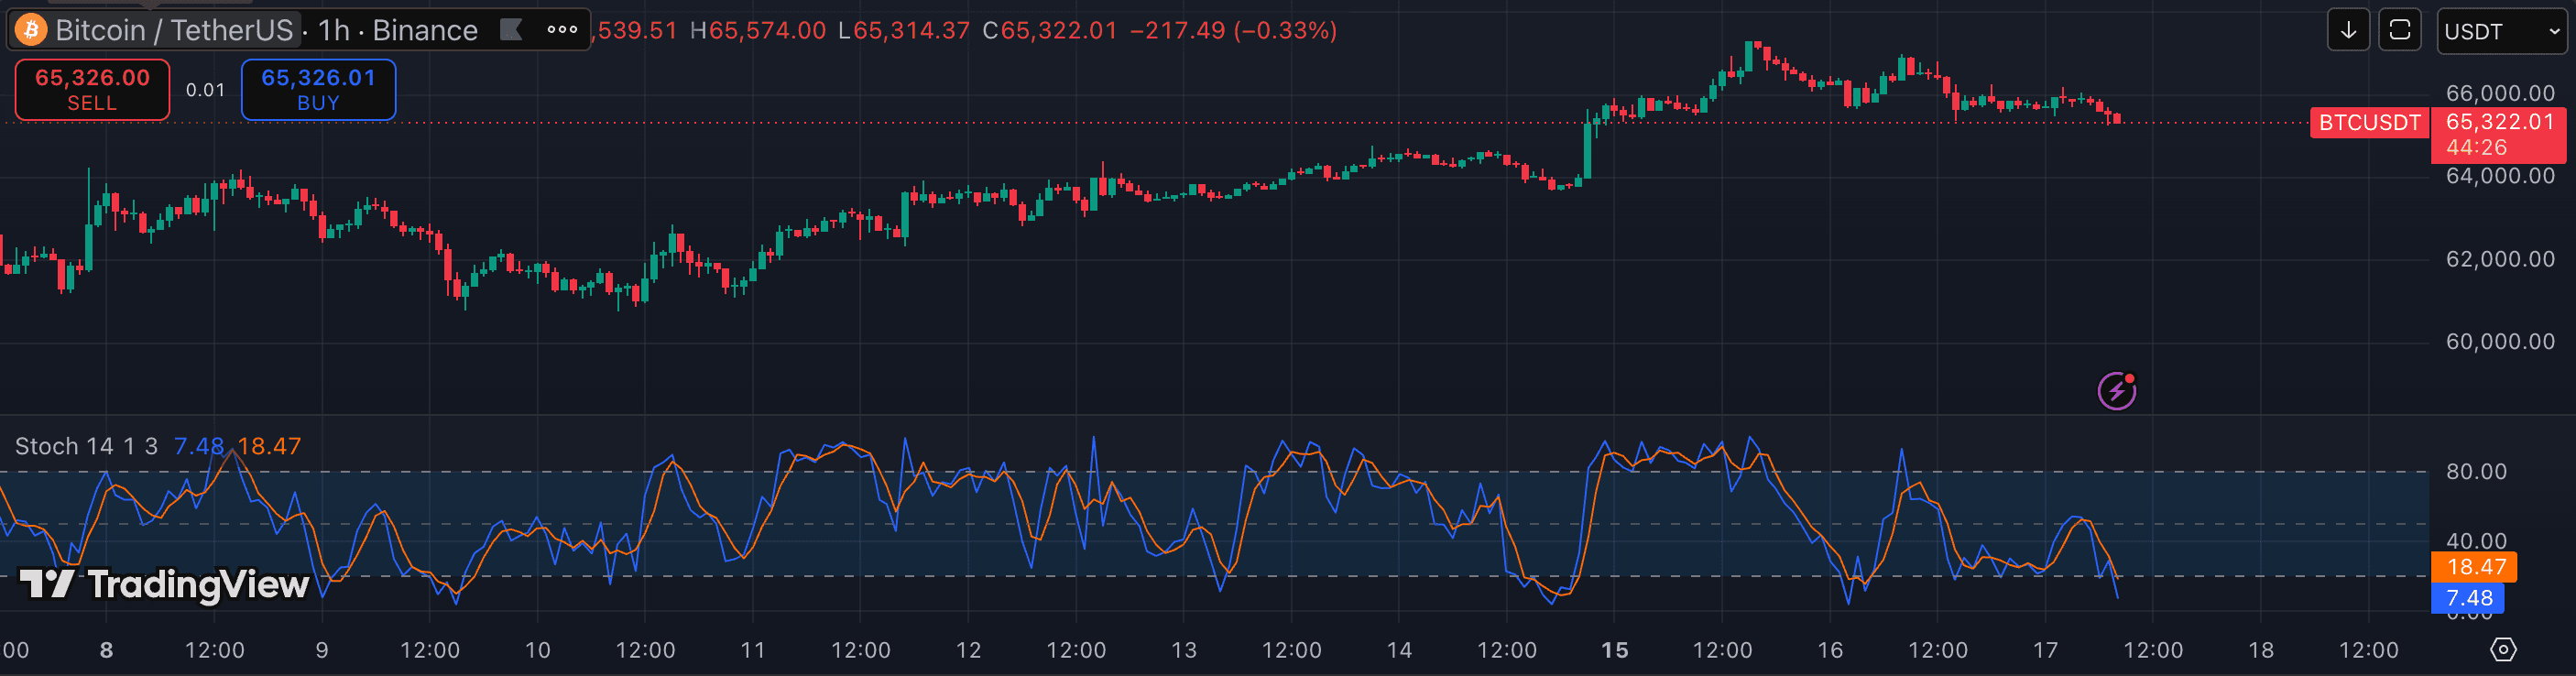
| Category | Momentum | Momentum |
| Default period | 14 | 14, 3, 3 |
| Output | Single line, 0–100 | %K + %D lines, 0–100 |
| Best timeframe | 1h · 4h | 5m · 15m · 1h |
| Lag | Medium | Low |
| Divergence quality | ★★★★☆ | ★★★☆☆ |
| Best for | Trend pullbacks | Range reversals |
| Worst in | Tight ranges | Strong trends |
Verdict
Which should you choose?
If you trade BTC/ETH on 1h and above, RSI is still the better one-glance read — its divergence behavior on crypto majors is hard to beat. If you're scalping defined ranges on 5m–15m, Stochastic's two-line crossover gives you faster, cleaner reversal triggers — at the cost of more whip during trend days.
Best move: put RSI on your higher-timeframe anchor and Stochastic on your entry timeframe. They're complements, not competitors.
Pick RSI if
- You're a swing trader
- You hate cluttered charts
- You trade BTC/ETH 1h+
Pick Stochastic if
- You scalp 1m–15m
- You trade ranges & mean-reversion
- You like crossover triggers
— MORE HEAD-TO-HEAD
Other comparisons
MACD vs RSI Supertrend vs Parabolic RSI vs Stochastic Bollinger vs Keltner RSI vs ADX VWAP vs Volume MACD vs Stochastic Supertrend vs Moving WaveTrend vs Stochastic OBV vs CVD ADX vs ATR Ichimoku vs Supertrend Supertrend vs MACD Bollinger vs ATR MACD vs Bollinger OBV vs MACD RSI vs Bollinger RSI vs MACD Keltner vs Bollinger Volume vs OBV VWAP vs Moving ADX vs MACD Ichimoku vs Moving OBV vs VWAP Squeeze vs MACD WaveTrend vs MACD Squeeze vs RSI Supertrend vs RSI UT vs Supertrend LuxAlgo vs VuManChu
Not investment advice. PineRadar is an editorial directory — links may be affiliate. Always test indicators on a demo account.