RSI (Relative Strength Index) measures the speed of recent price change on a 0–100 scale. It's the friendliest first oscillator, but most beginners misuse it by shorting every '70' and buying every '30'. Here's how to actually read it on crypto.
1. Add it and set your timeframe bias
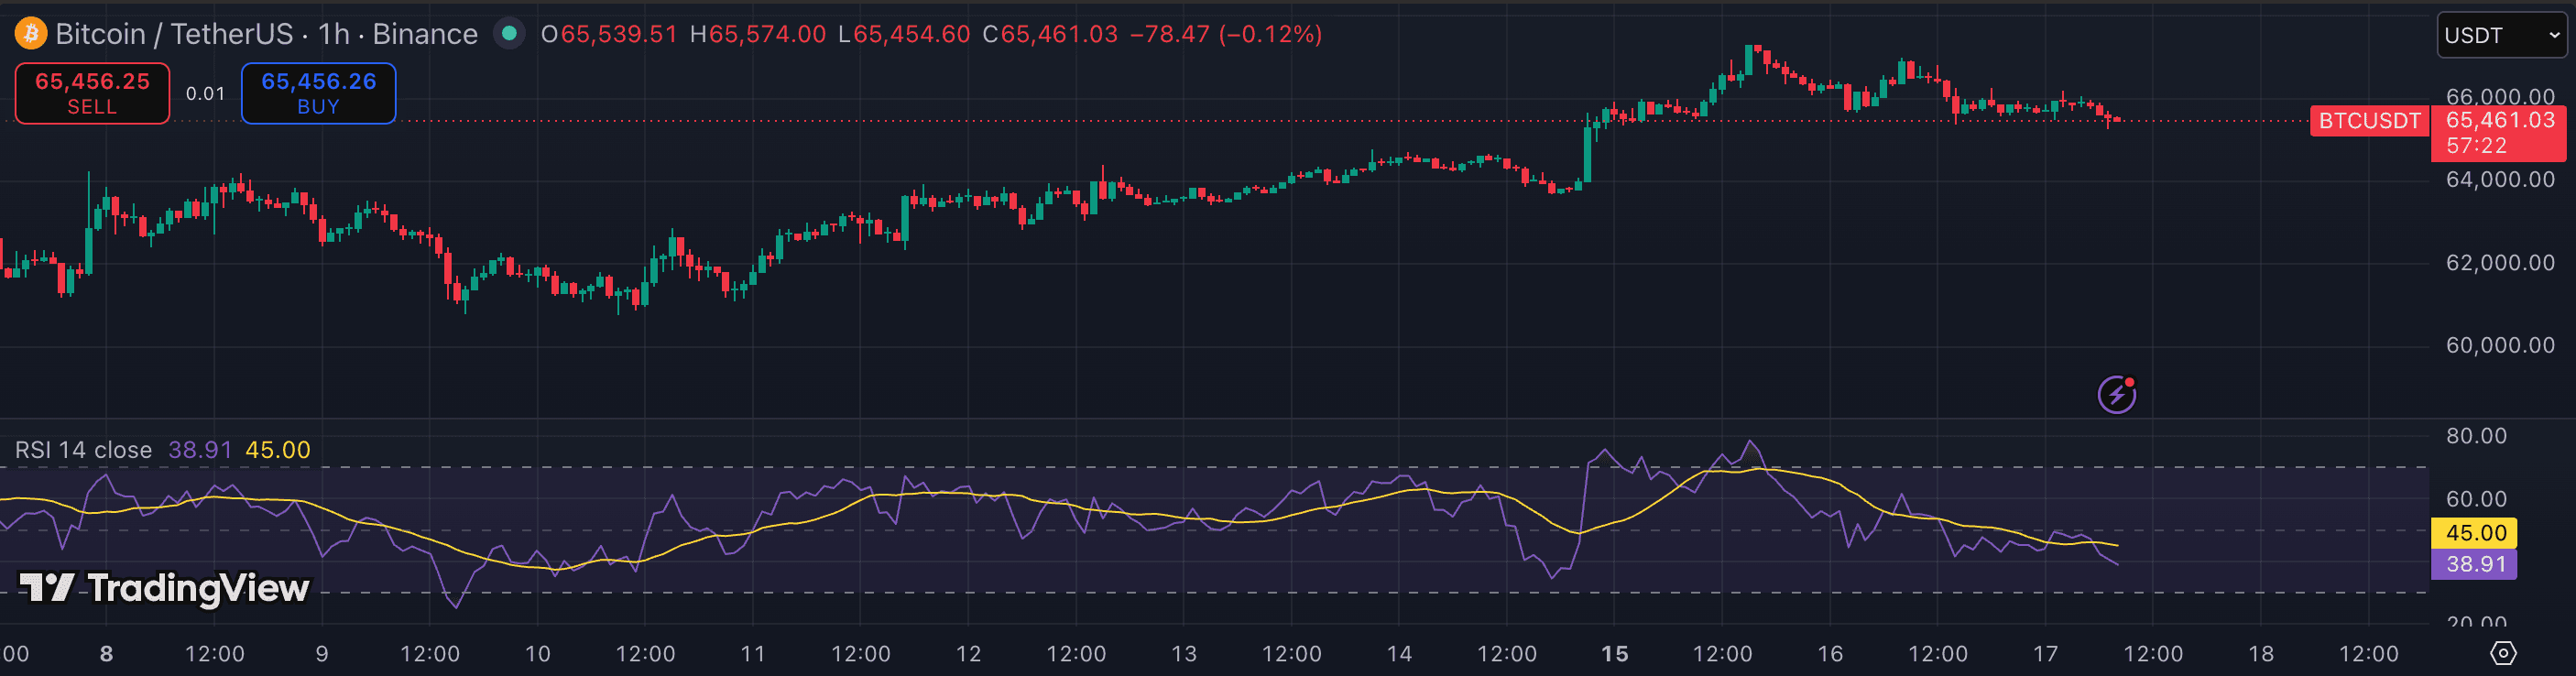
Add RSI from TradingView's indicator list — it ships built-in, no script needed. Leave the length at 14 to start.
Decide which timeframe is your bias. On crypto, RSI's divergence behavior is cleanest on 1h and above. Use the higher timeframe for direction, not your entry chart.
2. Read trend, not just levels
In an uptrend, RSI tends to oscillate between roughly 40 and 80 — pullbacks to the 40–50 zone are the buyable dips, not a reason to short. In a downtrend it lives between 20 and 60.
That shifting range is the real signal. A market that suddenly holds above 50 after living below it is telling you momentum regime has changed.
3. Hunt divergence for reversals
Bullish divergence: price makes a lower low while RSI makes a higher low — momentum is fading on the downside. Bearish divergence is the mirror.
Divergence is a warning, not a trigger. Wait for a structure break or candle confirmation before acting on it.
4. Combine, don't isolate
RSI is an exhaustion read. Pair it with a trend tool (a moving average or Supertrend) and a level (VWAP or volume profile) so you're entering with confluence, not on a single number.
- Shorting just because RSI hit 70 — in a strong trend it can stay 'overbought' for days.
- Trading divergence with no confirmation — it can persist far longer than your stop.
- Using RSI alone on a 1m chart, where noise overwhelms the signal.
- Tweaking the length endlessly instead of learning to read the default.