COMPARISON · UPDATED 2026-06-10
MACDvsRSI
The two most-searched indicators on TradingView, constantly pitted against each other. They measure different things — here's when each one wins.
— SIDE BY SIDE
The attributes that matter.
| Attribute | MACD | RSI |
|---|---|---|
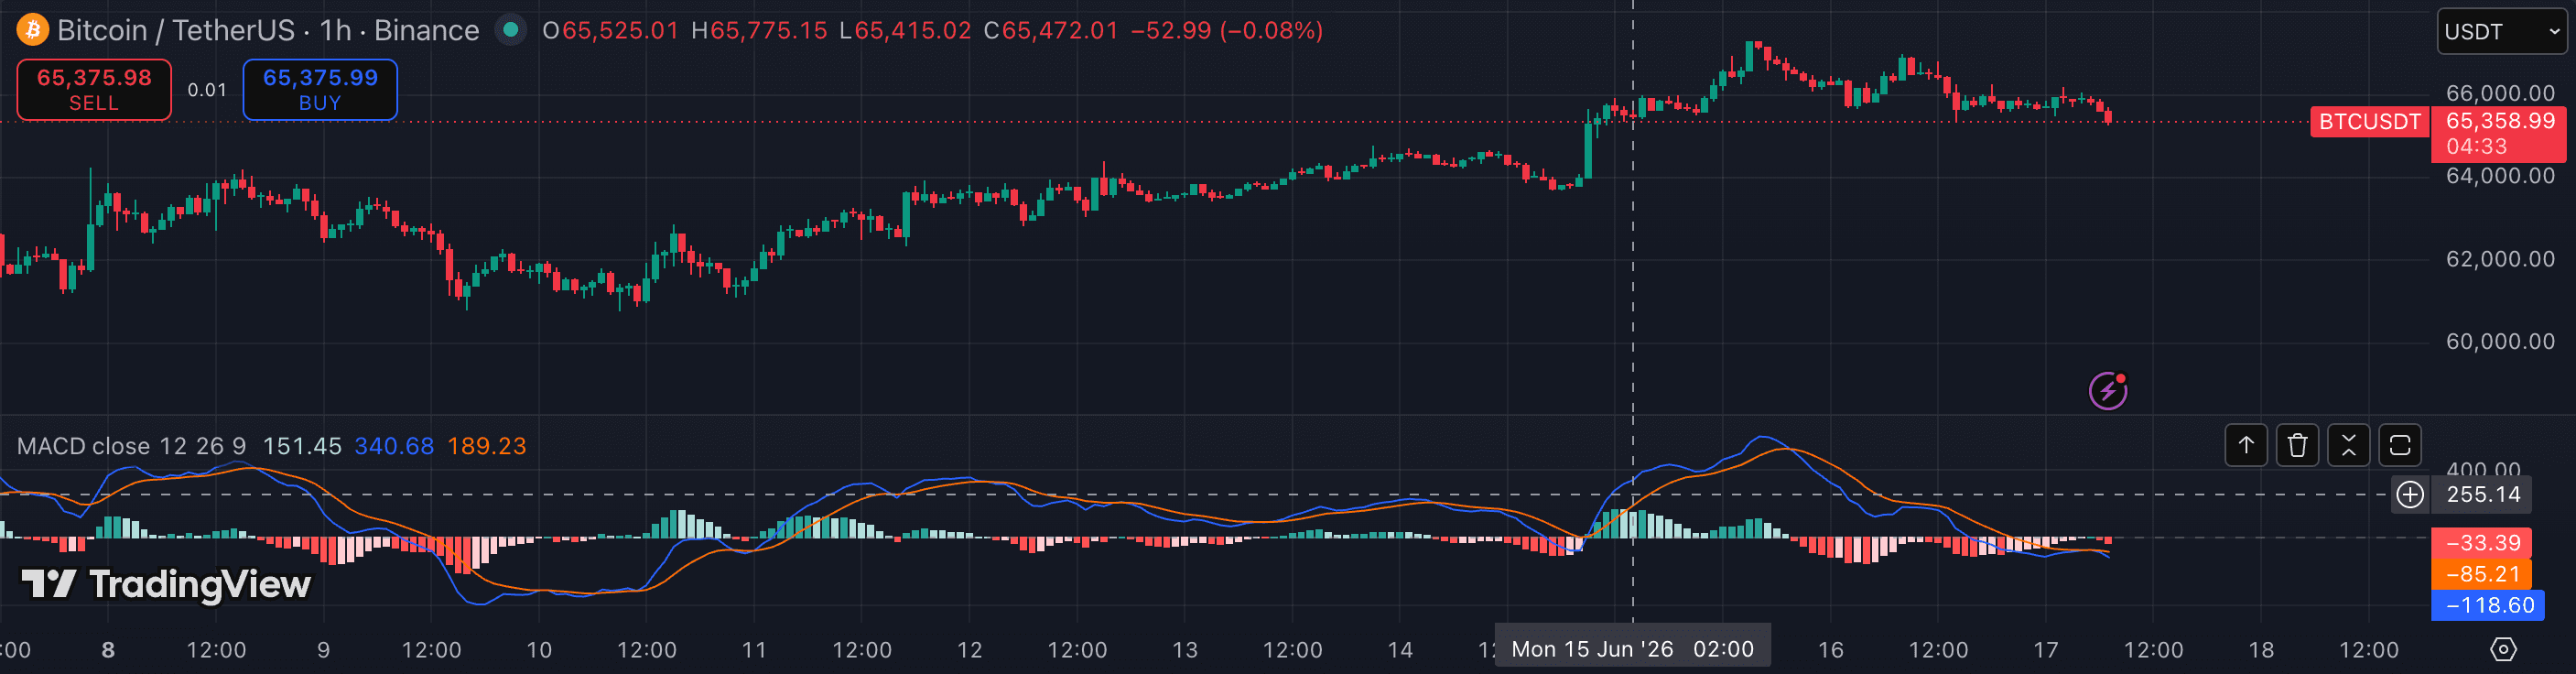
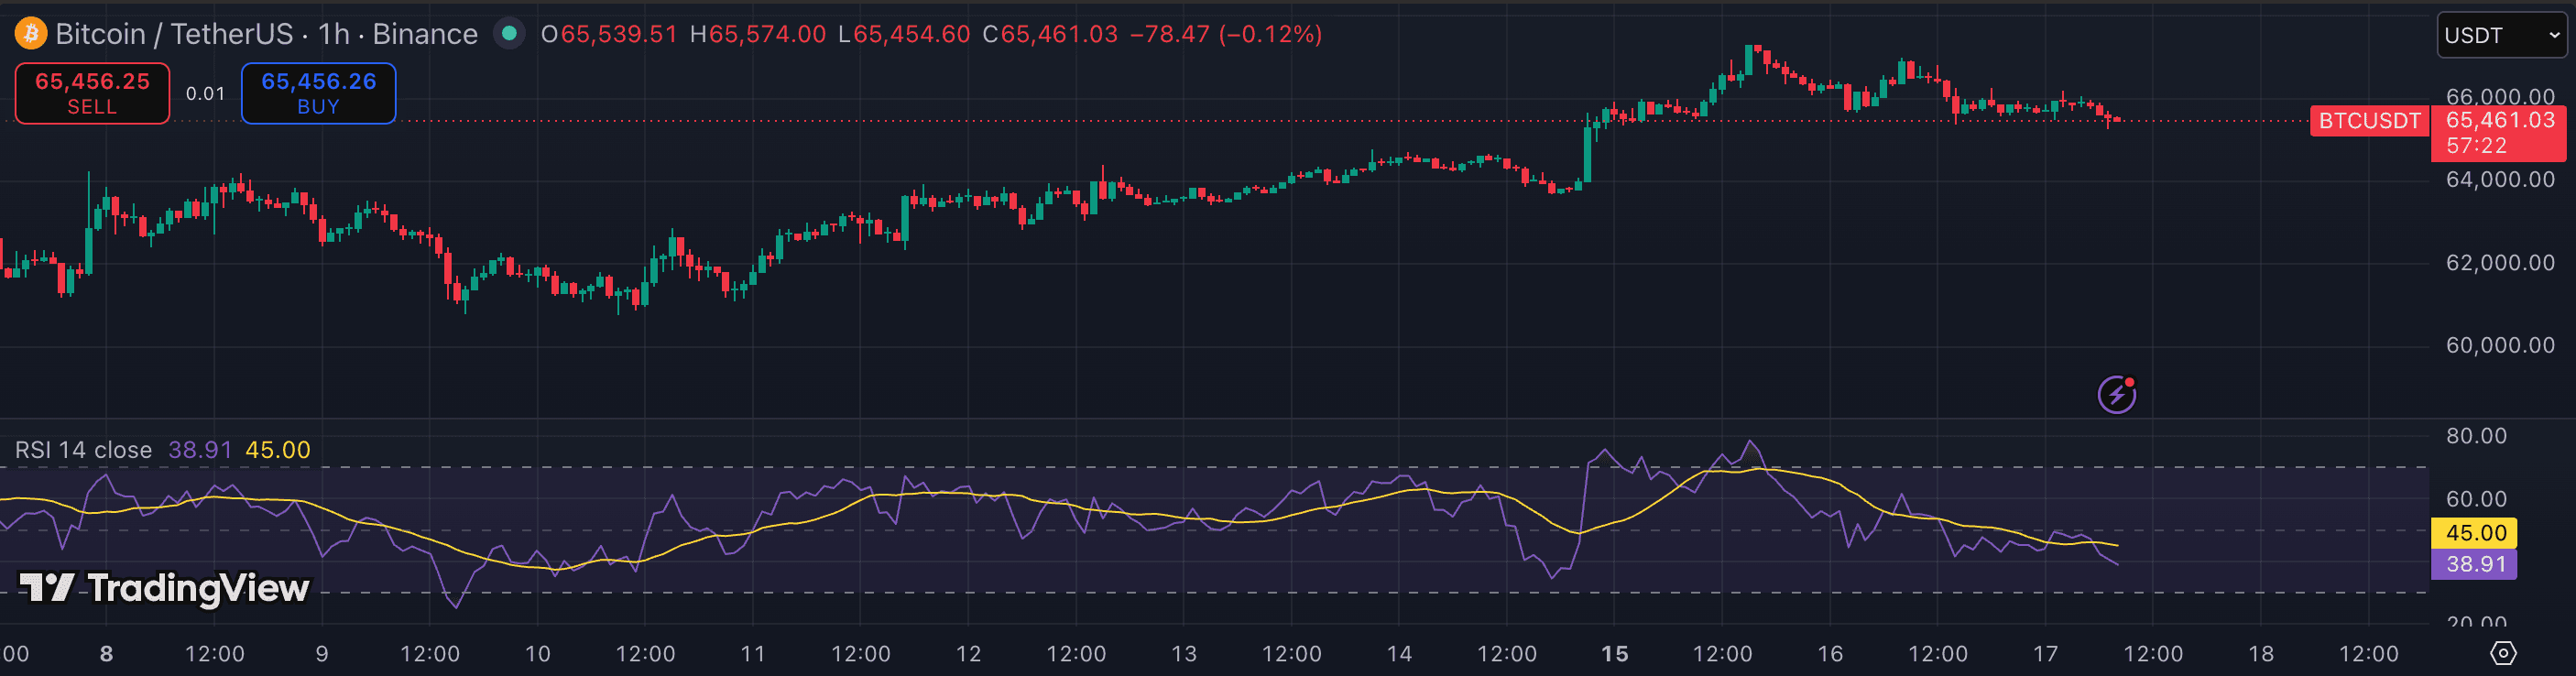
| Category | Momentum + trend | Momentum |
| Default period | 12, 26, 9 | 14 |
| Output | Two lines + histogram | Single line, 0–100 |
| Measures | Trend + momentum shift | Speed of recent change |
| Best timeframe | 1h · 4h · 1D | 1h · 4h |
| Lag | Higher | Medium |
| Best for | Trend confirmation | Exhaustion / reversals |
| Worst in | Ranges | Strong trends |
Verdict
Which should you choose?
MACD is a trend-and-momentum tool: use it to confirm a move is underway and to read whether momentum is building or fading via the histogram. RSI is an exhaustion tool: use it to spot when a move is overextended or diverging.
They answer different questions, so the smart setup runs both — MACD for the 'is there a trend' read and RSI for the 'is it running out of gas' read. If you must pick one for trending crypto, MACD; for ranges and reversals, RSI.
Pick MACD if
- You trade trends
- You want momentum + direction
- You like the histogram early-warning
Pick RSI if
- You hunt reversals
- You want one simple read
- You trade exhaustion on majors
— MORE HEAD-TO-HEAD
Other comparisons
RSI vs Stochastic Supertrend vs Parabolic RSI vs Stochastic Bollinger vs Keltner RSI vs ADX VWAP vs Volume MACD vs Stochastic Supertrend vs Moving WaveTrend vs Stochastic OBV vs CVD ADX vs ATR Ichimoku vs Supertrend Supertrend vs MACD Bollinger vs ATR MACD vs Bollinger OBV vs MACD RSI vs Bollinger RSI vs MACD Keltner vs Bollinger Volume vs OBV VWAP vs Moving ADX vs MACD Ichimoku vs Moving OBV vs VWAP Squeeze vs MACD WaveTrend vs MACD Squeeze vs RSI Supertrend vs RSI UT vs Supertrend LuxAlgo vs VuManChu
Not investment advice. PineRadar is an editorial directory — links may be affiliate. Always test indicators on a demo account.