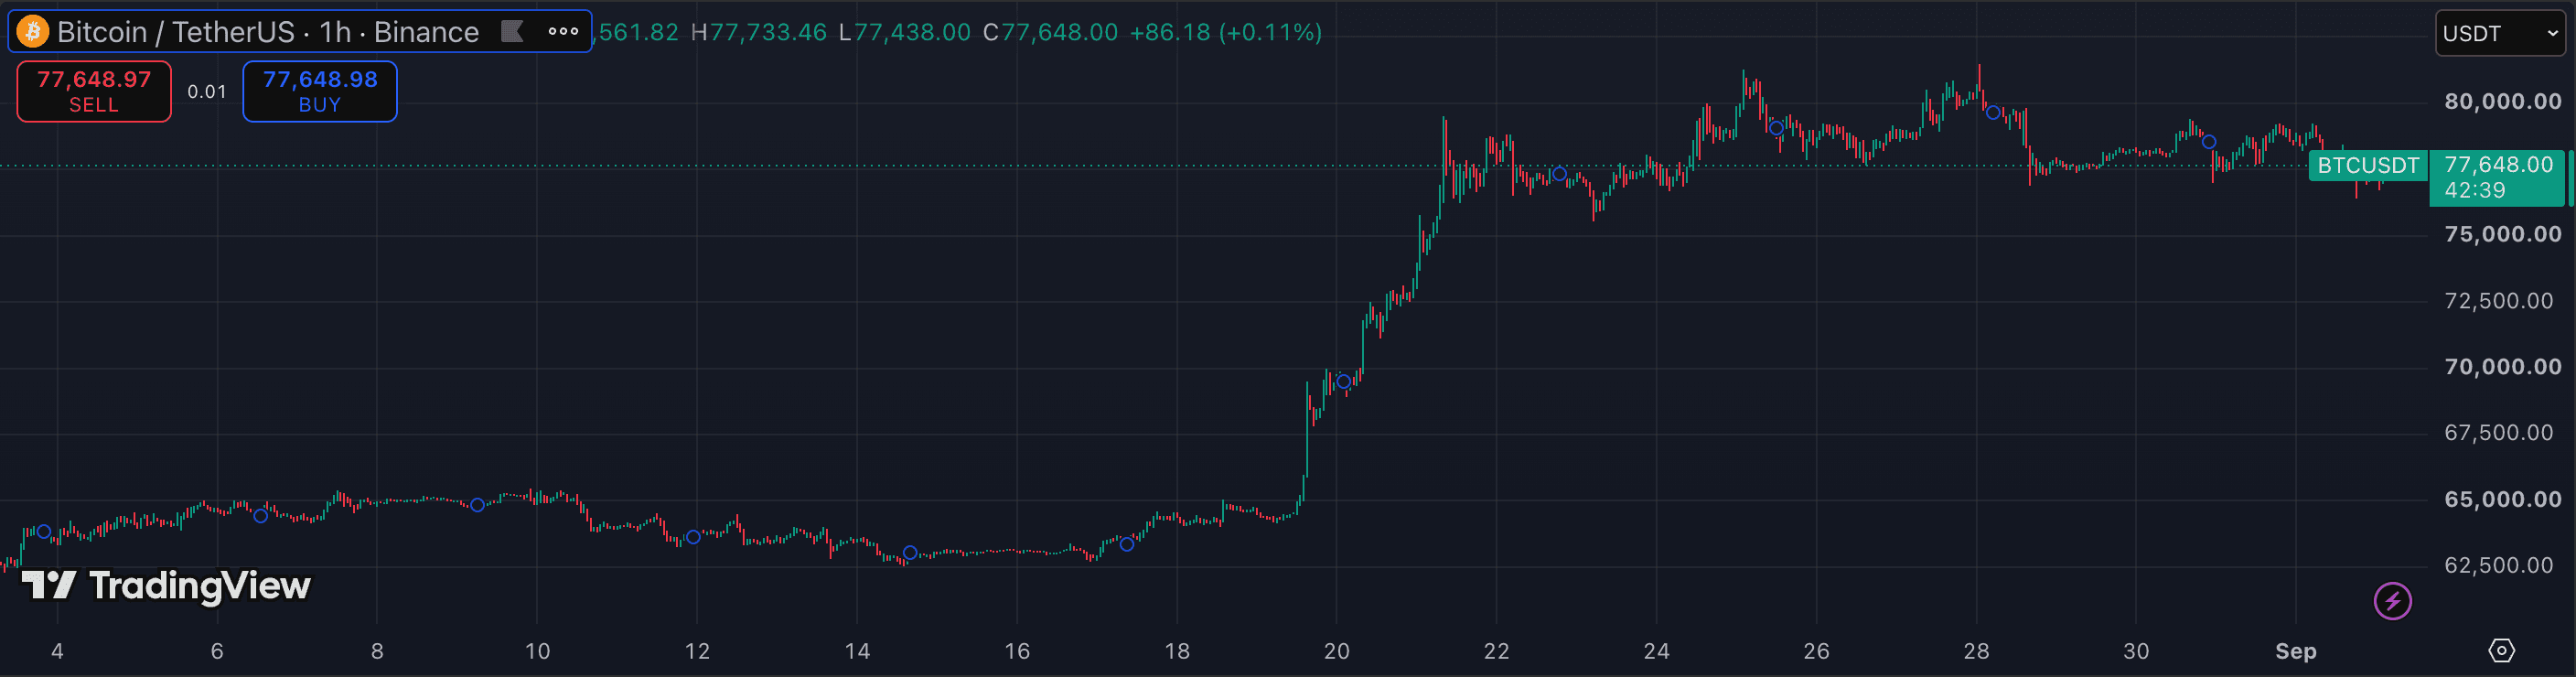
Every indicator in TradingView is calculated from candlestick data. Before layering RSI, MACD, or Supertrend on top, you need to understand what regular candlesticks show: the exact open, high, low, and close price for each bar. This guide covers the fundamentals and how to read structure, not just individual candles.
1. Understand the anatomy of a single candle
Each candle has a body (the rectangle spanning open to close) and wicks (the thin lines extending to the bar's high and low). A green or white candle closed higher than it opened. A red or black candle closed lower.
The body size shows conviction: a long green body means buyers dominated the whole session. A small body with long wicks means both sides fought and neither won decisively — indecision.
2. Read wicks as rejection signals
A long upper wick on an otherwise green candle means buyers pushed price up, but sellers stepped in and pushed it back down before close. That is rejection of higher prices — a warning not a reversal guarantee.
In crypto, wick hunts are common: price spikes briefly above a key level to trigger stop-losses, then reverses. Identifying these on the chart helps you avoid placing stops in obvious clusters.
3. Identify swing structure, not just candles
Trend is read from the sequence of swing highs and swing lows, not individual candles. An uptrend is a series of higher highs and higher lows; a downtrend is lower highs and lower lows.
The key level is the most recent swing low in an uptrend. If price breaks that level with a close below it, the structure has shifted — this is more reliable than any individual candle pattern.
4. Spot support and resistance from price history
Horizontal levels where price has previously reversed — either up or down — tend to act again. High-volume areas (visible as candle clusters at similar prices) carry more weight than isolated spikes.
For crypto, focus on the daily and weekly close levels, prior swing highs and lows, and round-number price levels. These are the areas where many participants have orders and where reactions are most common.
5. Add indicators on top of structure, not instead of it
RSI, MACD, and volume indicators work best when you already know the structural context from the raw candles. An RSI divergence at a prior swing high is meaningful; the same signal in open space is noise.
The sequence is always: identify trend direction from swing structure first, find the level from price history second, then use an indicator for entry timing.
- Memorising pattern names (doji, hammer, engulfing) without understanding the structural context — a hammer at a prior swing low matters; the same candle in open space does not.
- Trading wicks as reversal signals immediately — wicks show rejection but not confirmation. Wait for a close in the opposite direction before acting.
- Ignoring volume — a breakout candle with below-average volume is far less reliable than one with a volume spike confirming participation.
- Switching to Heikin Ashi or Renko and forgetting to execute from real candle prices — synthetic charts hide the actual entry and exit levels.