— HOW IT WORKS
What Bollinger does, and when it works.
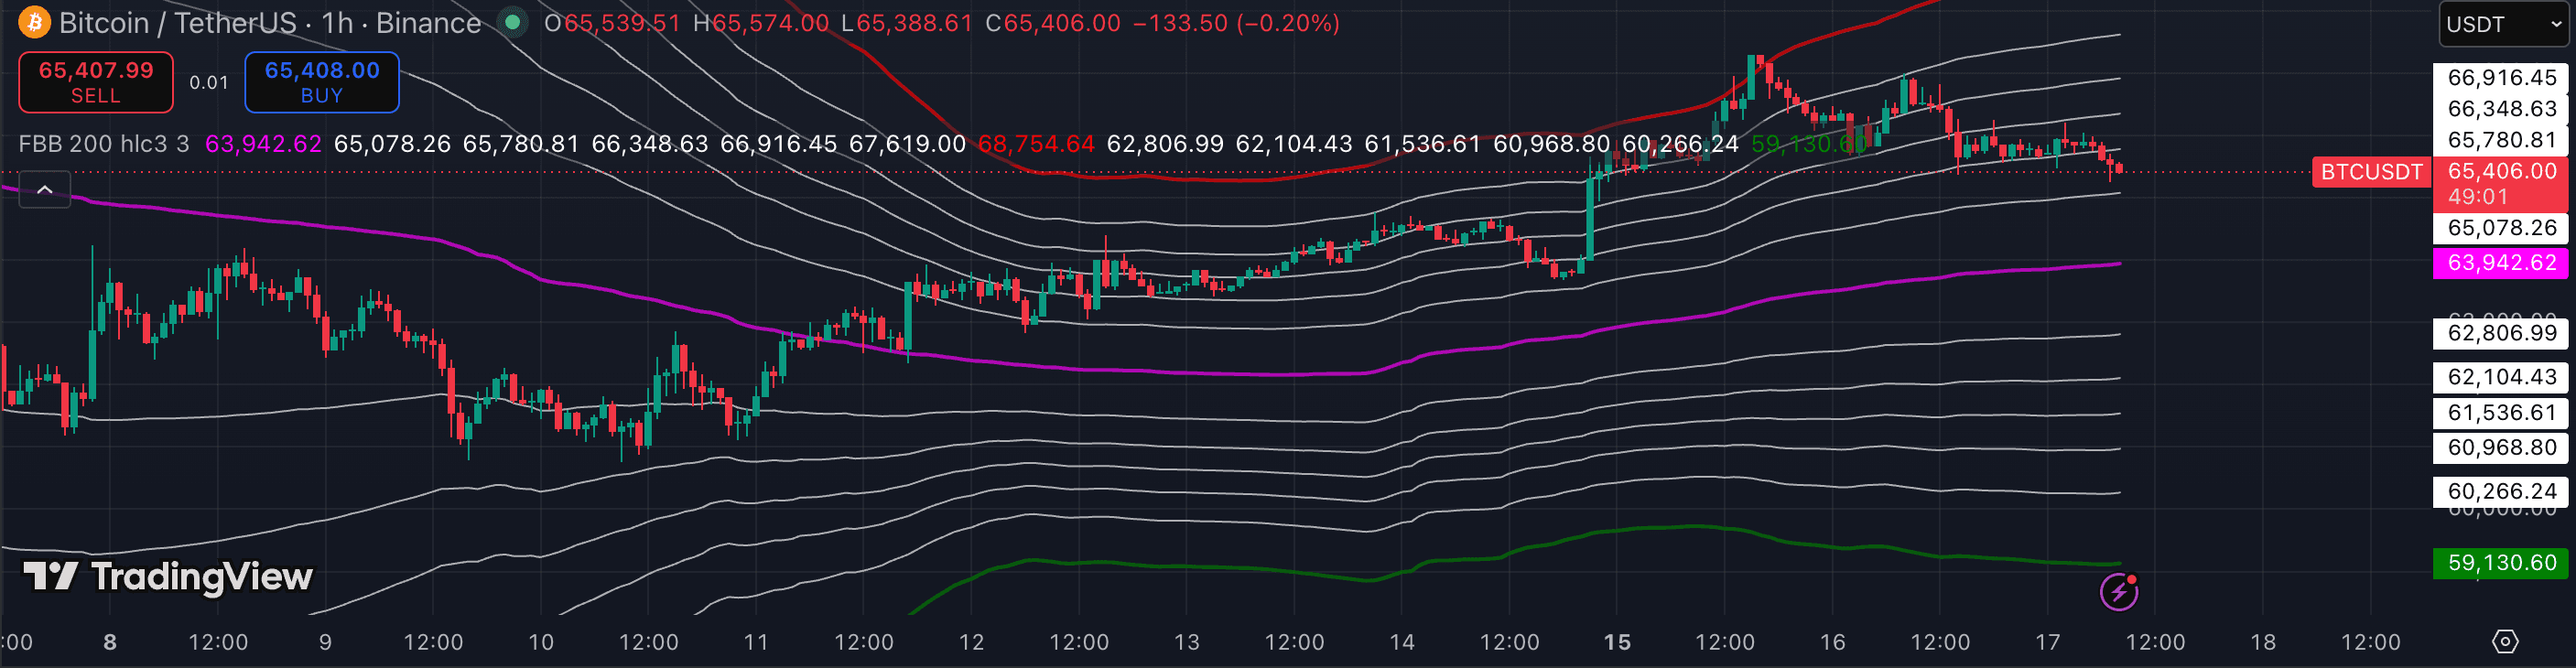
Bollinger Bands plot a moving average with two bands set a number of standard deviations away (default 20, 2). The bands widen when volatility rises and contract when it falls, so the width itself is information.
Tags of the outer band flag stretched price; a 'squeeze' (narrow bands) often precedes a volatility expansion. In trends, price rides the upper or lower band — a band tag is not automatically a reversal.
Best used for context and mean-reversion in ranges. For breakouts, watch the squeeze rather than the band tags.
— BEST FOR
Where it earns its slot.
cryptovolatilitybeginnersswing-trading