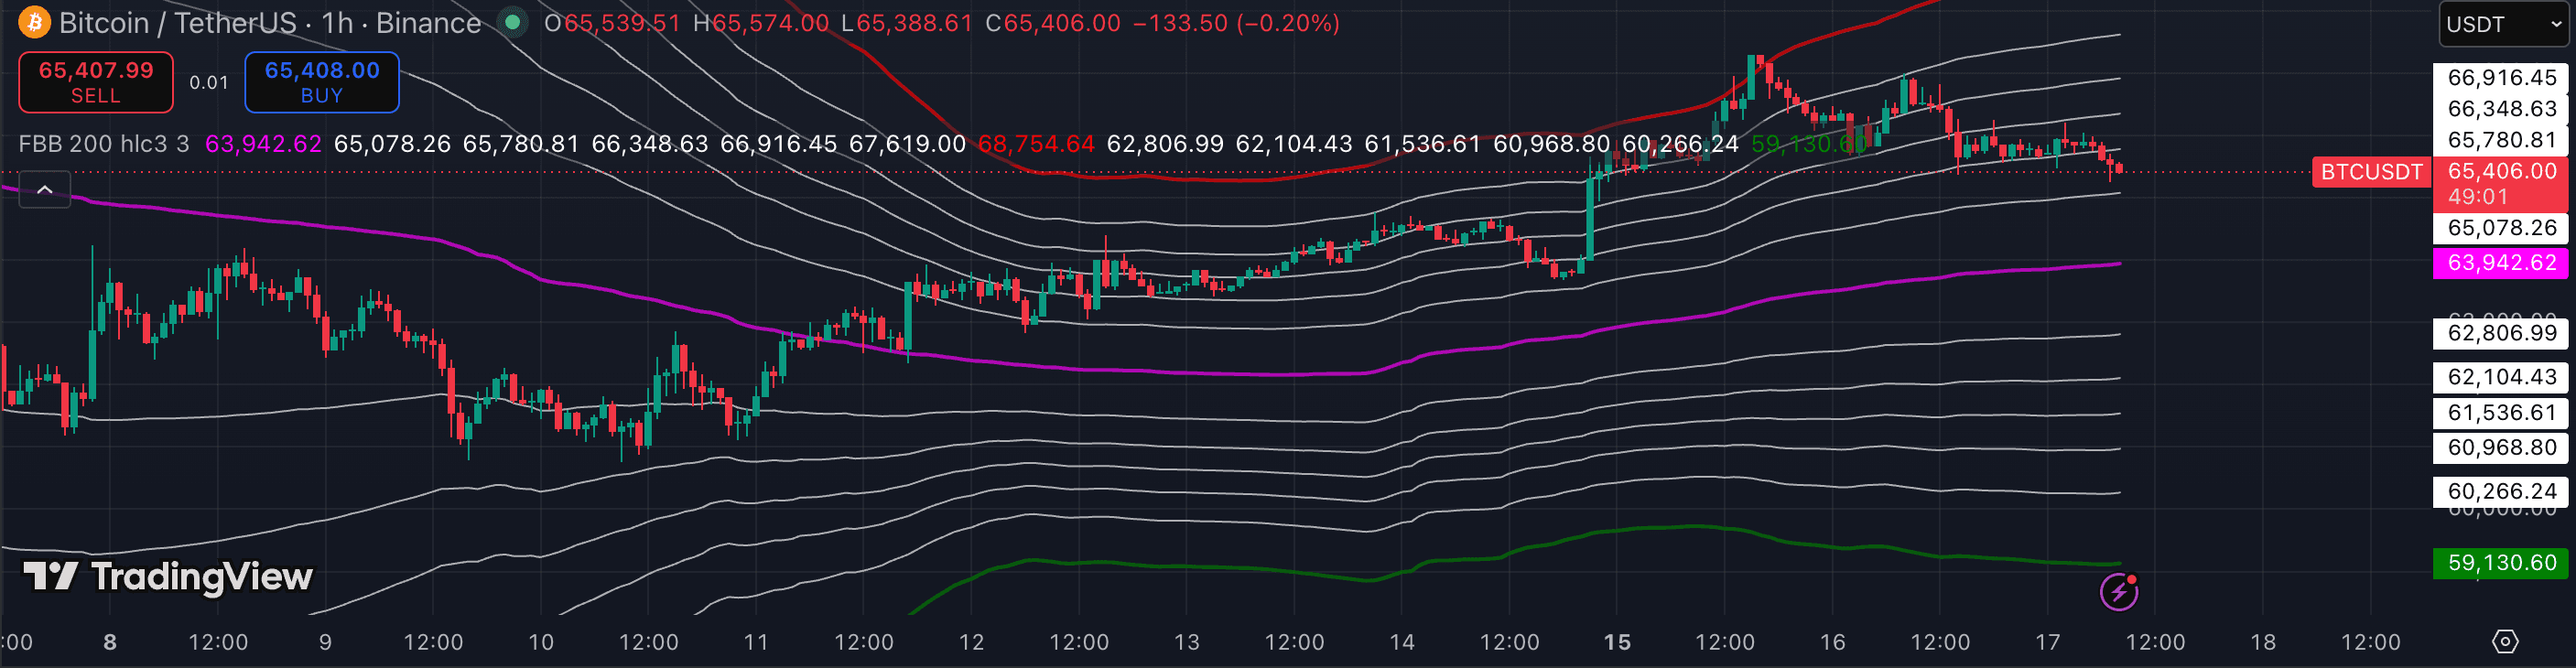
Bollinger Bands use two parameters: the moving average period (default 20) and the standard deviation multiplier (default 2). The standard settings capture roughly 95% of price action within the bands under a normal distribution assumption — but crypto prices are not normally distributed and have 'fat tails,' meaning extreme moves occur more often than the model expects. Understanding how to adjust these two parameters for different market conditions and timeframes is what separates traders who use Bollinger Bands as context from those who chase band tags.
1. Understand what the two parameters actually change
The period (default 20) controls the length of the middle moving average and the sample size for calculating standard deviation. A shorter period (e.g. 10) makes the bands react faster to recent price action — bands widen and narrow more quickly, and the middle line is more responsive. A longer period (e.g. 50) smooths out the calculation, producing wider, slower-moving bands that capture longer cycles.
The standard deviation multiplier (default 2) sets how far the outer bands sit from the middle line. At 2.0, roughly 95% of closes should fall inside the bands. Increasing it to 2.5 or 3.0 pushes the bands wider — fewer tags but the ones that occur represent more extreme price extensions. Reducing it to 1.5 brings the bands in — more frequent tags but lower significance per touch.
2. Keep the defaults for general use on 1h–4h charts
The default 20-period, 2 standard deviation setting is the most widely used combination on the 1h and 4h charts, and for good reason: the 20-period simple moving average is a near-universal reference point, and the ±2 SD bands cover the majority of recent price action without being so wide they lose visual usefulness.
On 1h and 4h crypto charts, the 20/2 defaults work well for identifying whether the market is in a trend (price walking along one band) or ranging (price oscillating between the bands). Both are readable conditions without parameter changes.
3. Widen the deviation in high-volatility conditions
When crypto markets are highly volatile — during major news events, macro shocks, or large-cap listings — the default 2 SD multiplier tags the bands constantly, making every touch meaningless as a signal. In these conditions, increasing the multiplier to 2.5 or 3.0 restores the 'rarity' of band touches that makes them actionable.
A practical approach: if you notice the price tagging the outer band four or more times in a single session on the 1h chart, the current volatility is too high for 2 SD to be a useful boundary. Switch to 2.5 or 3.0 for that period. When volatility normalises, return to the default.
4. Shorten the period for faster markets or lower timeframes
On 15m charts or for scalping on 5m, the 20-period setting produces bands that lag significantly behind fast price action. Reducing the period to 10 or 14 makes the bands react more quickly to recent bars, which is useful for short-term mean-reversion setups. The 14-period aligns with the default ATR and RSI period, making visual comparison across indicators easier.
For daily and weekly chart analysis, many traders extend the period to 30 or 50. The 50-period Bollinger Bands on a daily chart effectively track medium-term trend excursions — a tag of the upper 50/2 band is more significant than a tag of the 20/2 band because it represents a larger deviation from a longer mean.
5. Use squeeze width to time market entries
One of the most consistent applications of Bollinger Bands in crypto is watching for band width compression — the squeeze. When the bands narrow to their tightest width in months, the market is coiling before a volatility expansion. The direction of the subsequent break is not predictable from the bands alone, but the timing of a compression-to-expansion transition is useful.
Pair the squeeze with the band direction at the moment of expansion: if the bands are expanding and the upper band is rising steeply while the lower band is flat or rising, the expansion is bullish. If the lower band is dropping steeply while the upper is flat or dropping, it is bearish. This structural read from the band shape gives directional context without needing a separate indicator.
- Treating every outer-band touch as a reversal signal — in trending markets, price walks along the outer band for many bars with no reversal. A band touch is context, not a trade.
- Reducing the standard deviation below 1.5 for 'tighter' signals — at 1.5 SD, the bands capture only about 87% of price action, and tags become so frequent they carry no information.
- Changing both parameters at once after a failed trade — adjust one variable at a time to understand what each change does to the signal frequency and location.
- Using Bollinger Bands on 1m or 2m charts for scalping without adjusting the period — the default 20-bar SMA on a 1m chart is a 20-minute average that reacts too slowly for scalp entries.
- Ignoring the middle band — the 20-period SMA in the center is a reference level itself. In trending markets, the middle band acts as a dynamic support or resistance that is often more reliable than the outer bands.