Best TradingView indicators for options trading
Options pricing is driven by three forces: direction, volatility, and time. The indicators that earn a spot on an options trader's chart are the ones that directly measure at least one of these forces — or that improve the timing precision of an underlying directional read. This list focuses on equity and index options (SPY, QQQ, SPX) and crypto options (BTC, ETH), the two most liquid markets where TradingView traders commonly combine charting with options strategies. Disclaimer: this page is for educational purposes only and does not constitute investment advice.
- 01RANK
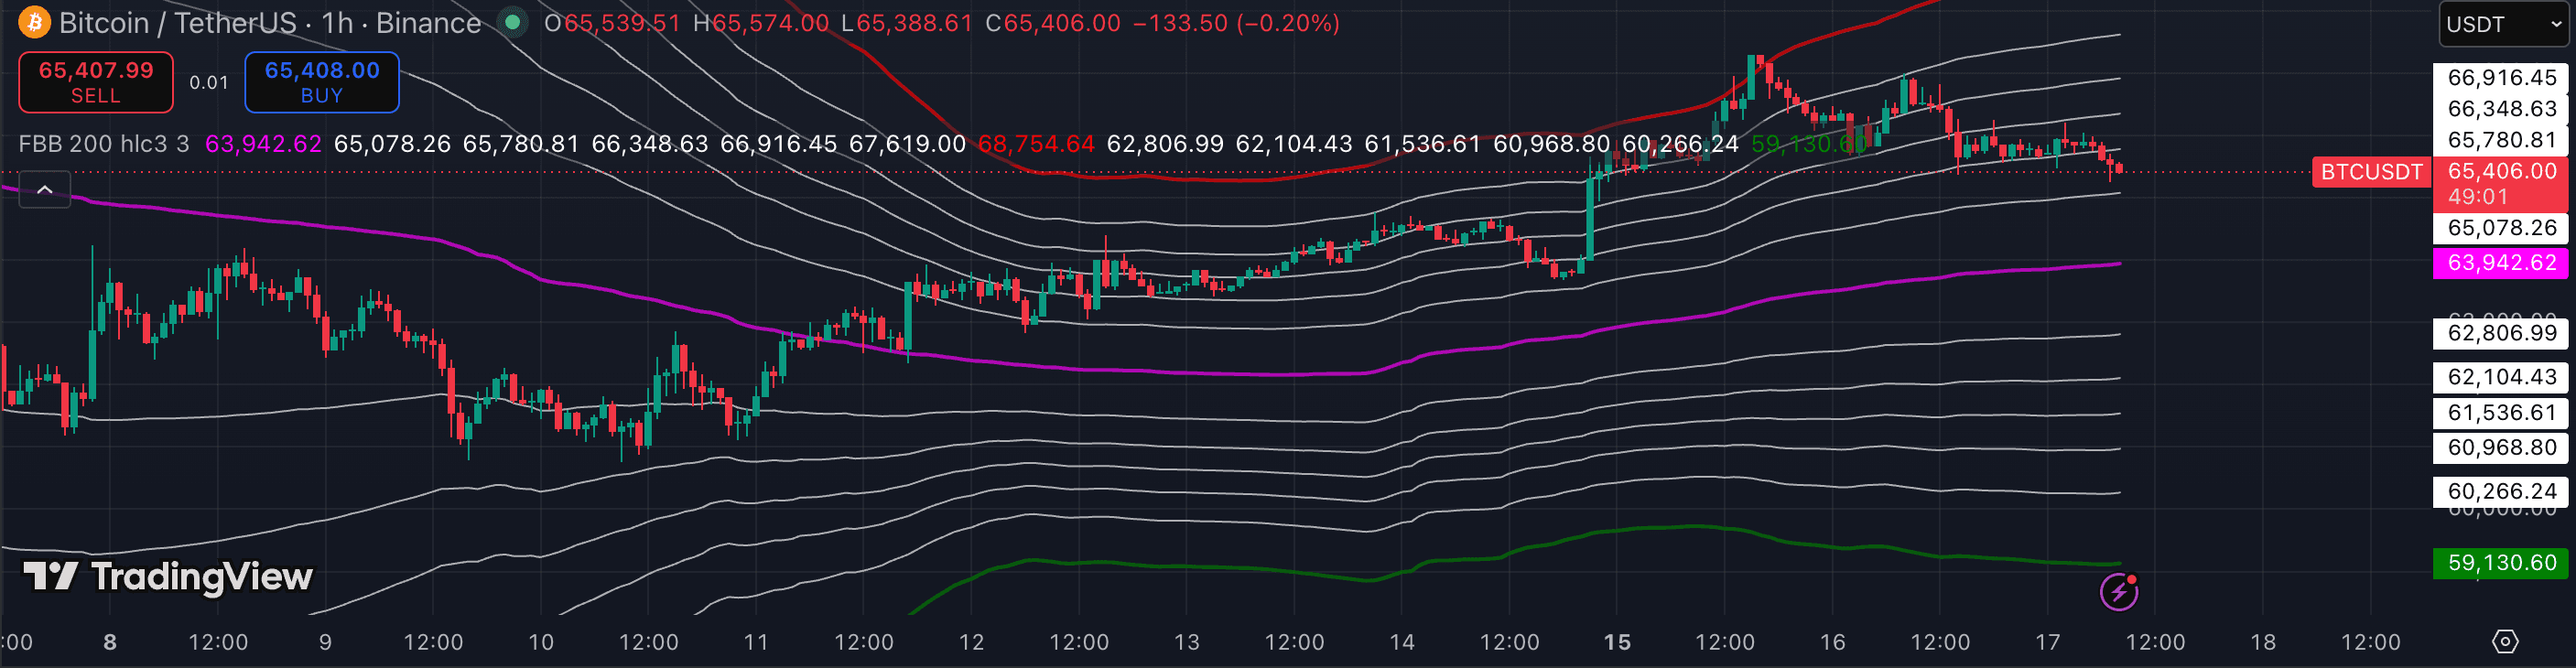
Bollinger Bands
volatilityBuilt-inBollinger Bands are the go-to volatility tool for options traders because band width maps directly to implied volatility expansion and compression. A Bollinger squeeze — bands narrowing over multiple sessions — signals that volatility is compressing, which is a common setup before a larger directional move. Conversely, extremely wide bands after a volatility spike warn against paying inflated premiums for directional options.
Best for: Range traders reading volatility·TFs:15m1h4hRead review4.2/5 - 02RANK
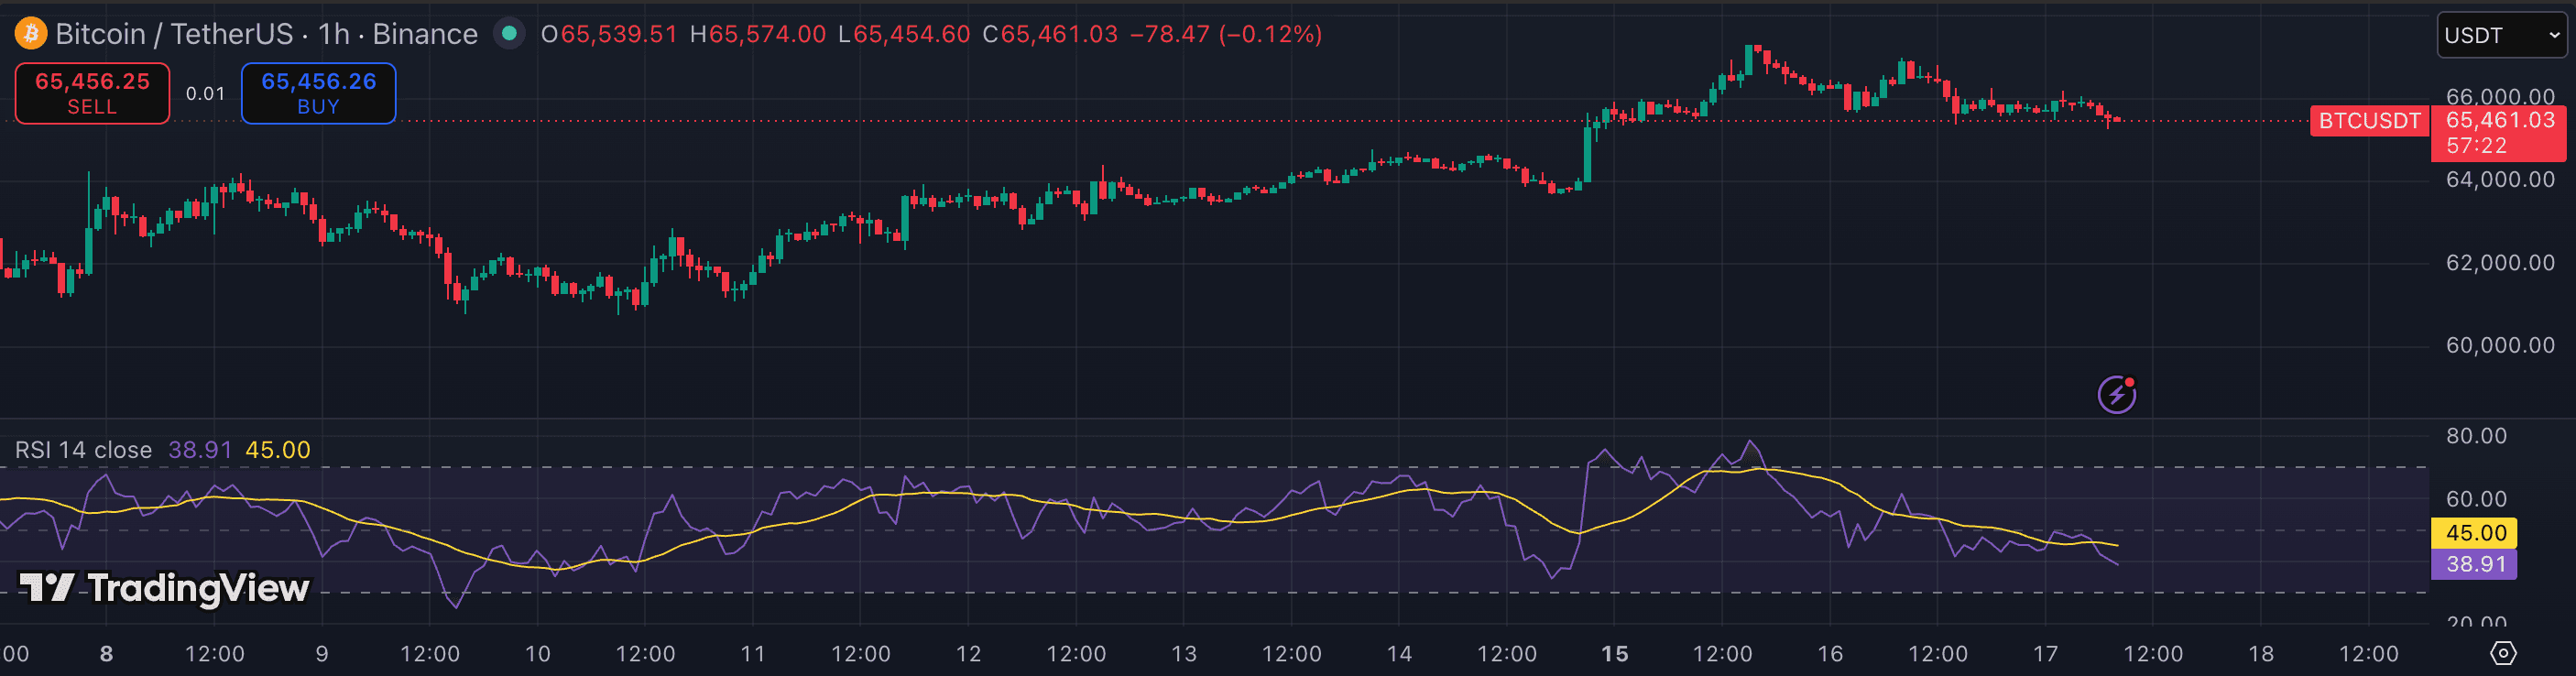
RSI (Relative Strength Index)
momentumBuilt-inRSI earns its place on options charts for two reasons: overbought/oversold reads that can help time protective entry points, and divergence signals that flag momentum exhaustion before a reversal. The 14-period default works well on the 1h–4h chart for timing weekly options entries. RSI also helps traders avoid chasing entries when momentum is already extended.
Best for: Swing entries on BTC/ETH 1h+·TFs:1h4hRead review4.3/5 - 03RANK
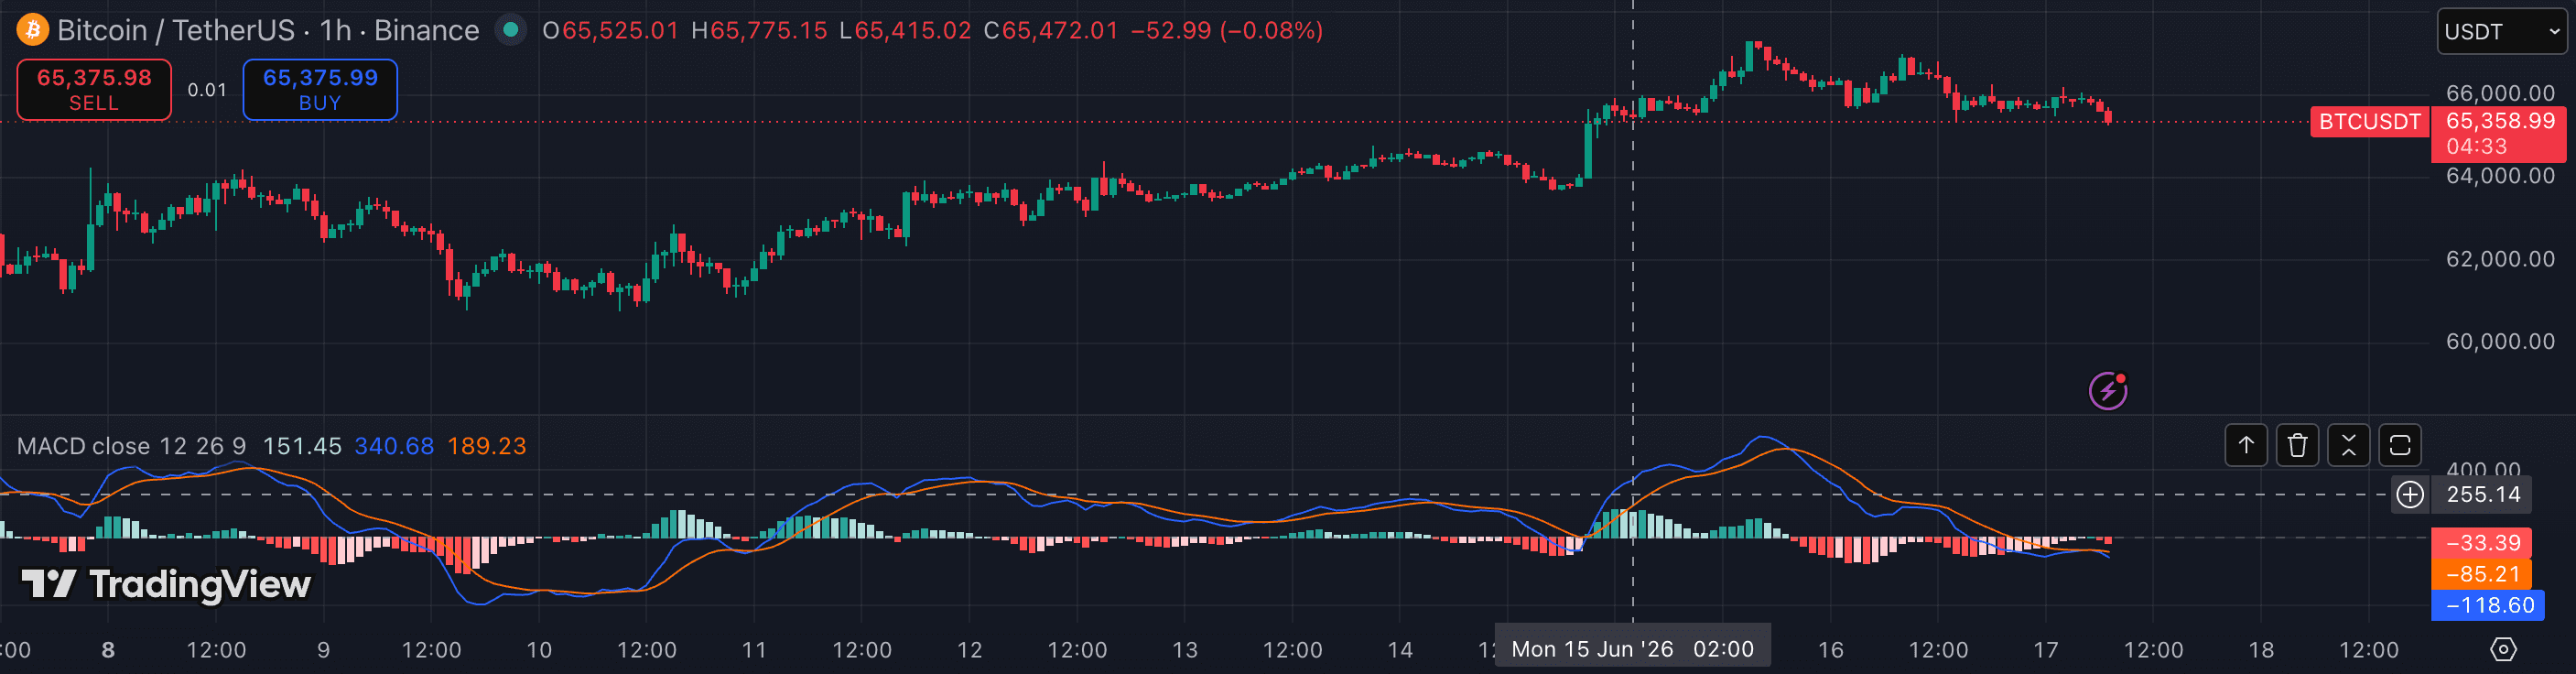
MACD
momentumBuilt-inMACD histogram momentum reads help options traders assess the directional bias on the underlying's next swing. A MACD histogram that compresses toward zero on the 4h chart after an uptrend is an early warning of potential trend weakening. The zero-line cross is a reliable regime-change signal that many multi-week options traders watch for positioning adjustments.
Best for: Traders who want trend and momentum on one pane·TFs:1h4h1DRead review4.1/5 - 04RANK
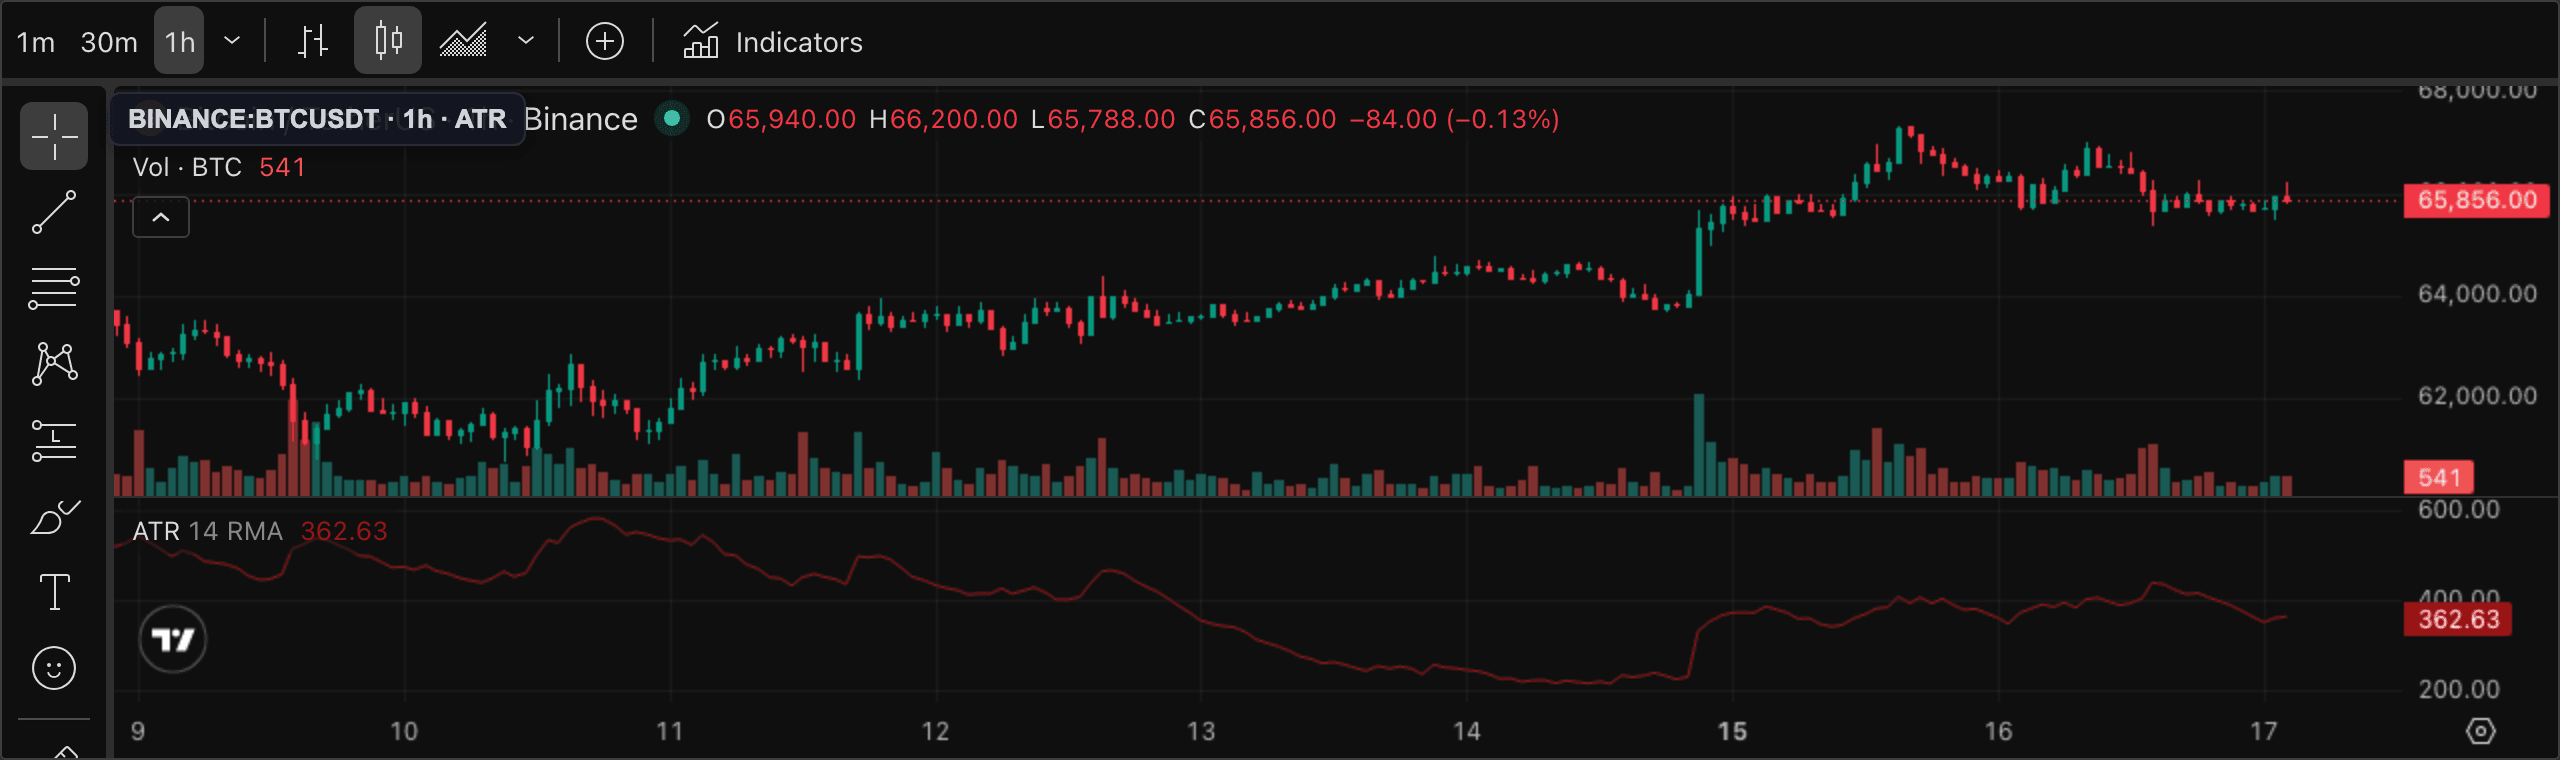
ATR (Average True Range)
volatilityBuilt-inATR is essential for options position sizing and strike selection. The 14-period daily ATR shows the average daily range of the underlying — traders use this to estimate expected moves and evaluate whether distance to a strike is realistic over a contract's remaining life. This is one of the most practical applications of ATR for derivatives traders.
Best for: Anyone sizing stops and targets·TFs:15m1h4hRead review4.3/5 - 05RANK
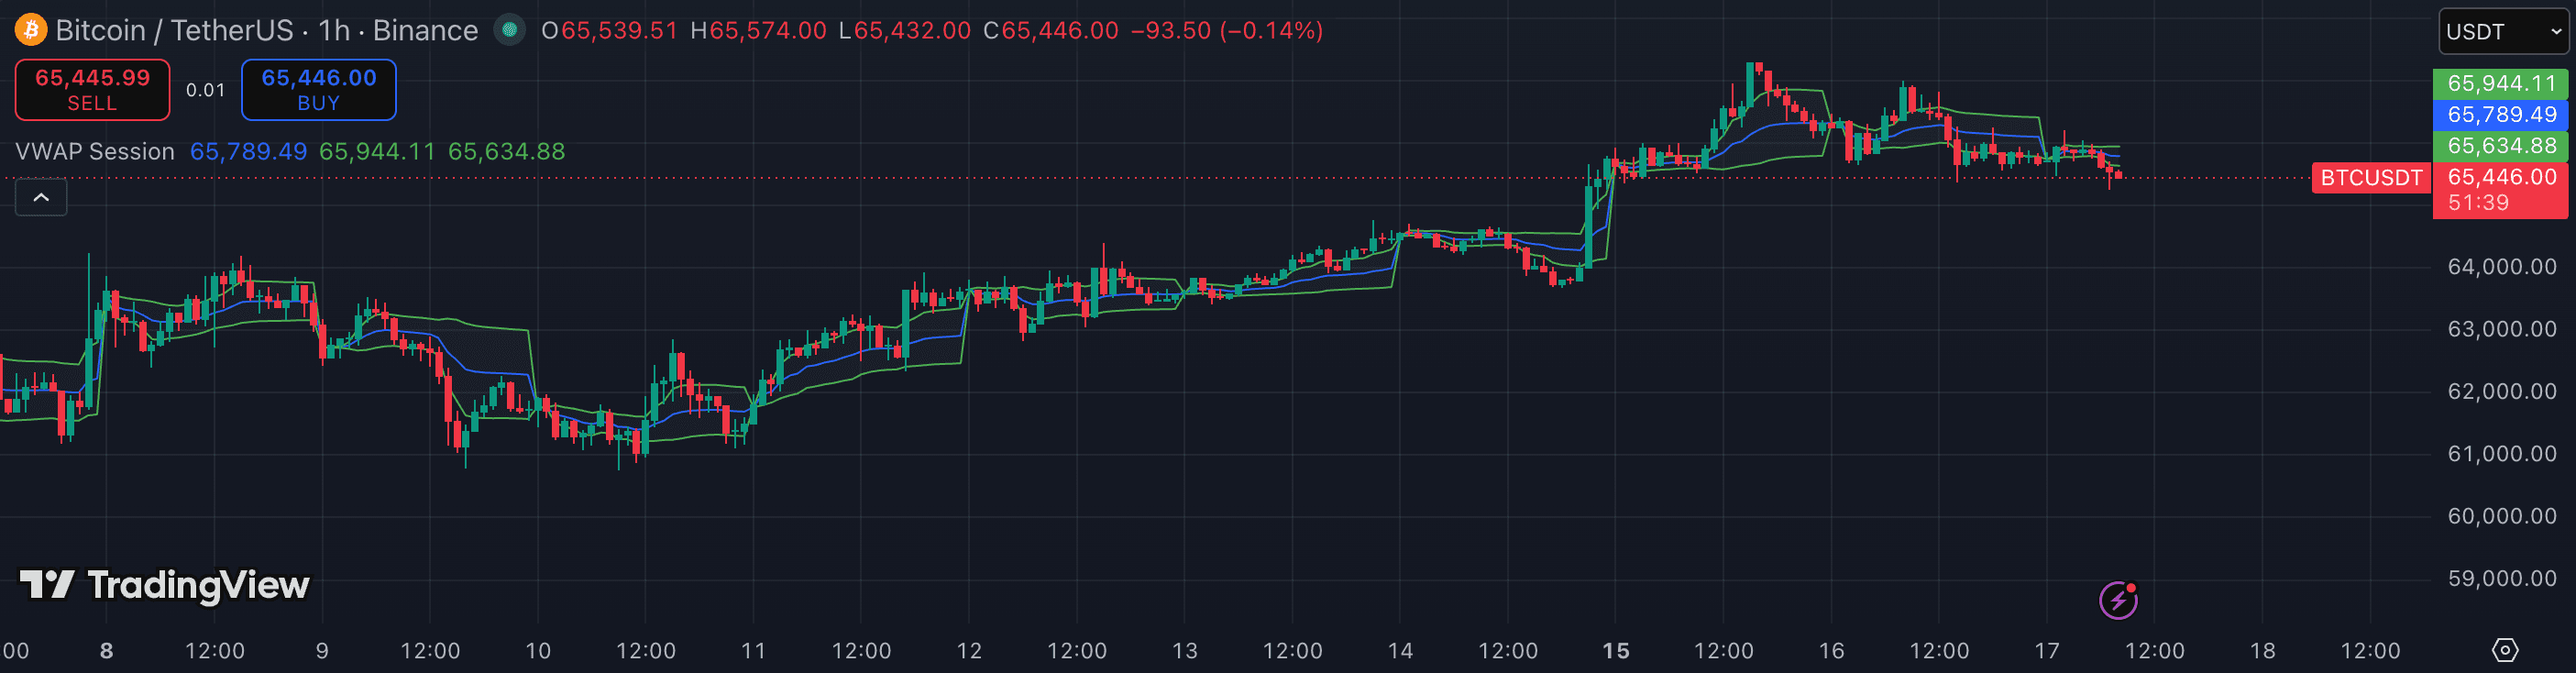
VWAP
volumeBuilt-inVWAP is the intraday reference used by institutional desks that are also active in the options market. Price above VWAP on a liquid underlying (SPY, QQQ) gives a directional tilt for short-dated entries; persistent rejection below VWAP supports a bearish directional read. VWAP deviations on 0-DTE options days are particularly high-signal for intraday traders.
Best for: Intraday traders needing a fair-value anchor·TFs:1m5m15mRead review4.6/5 - 06RANK
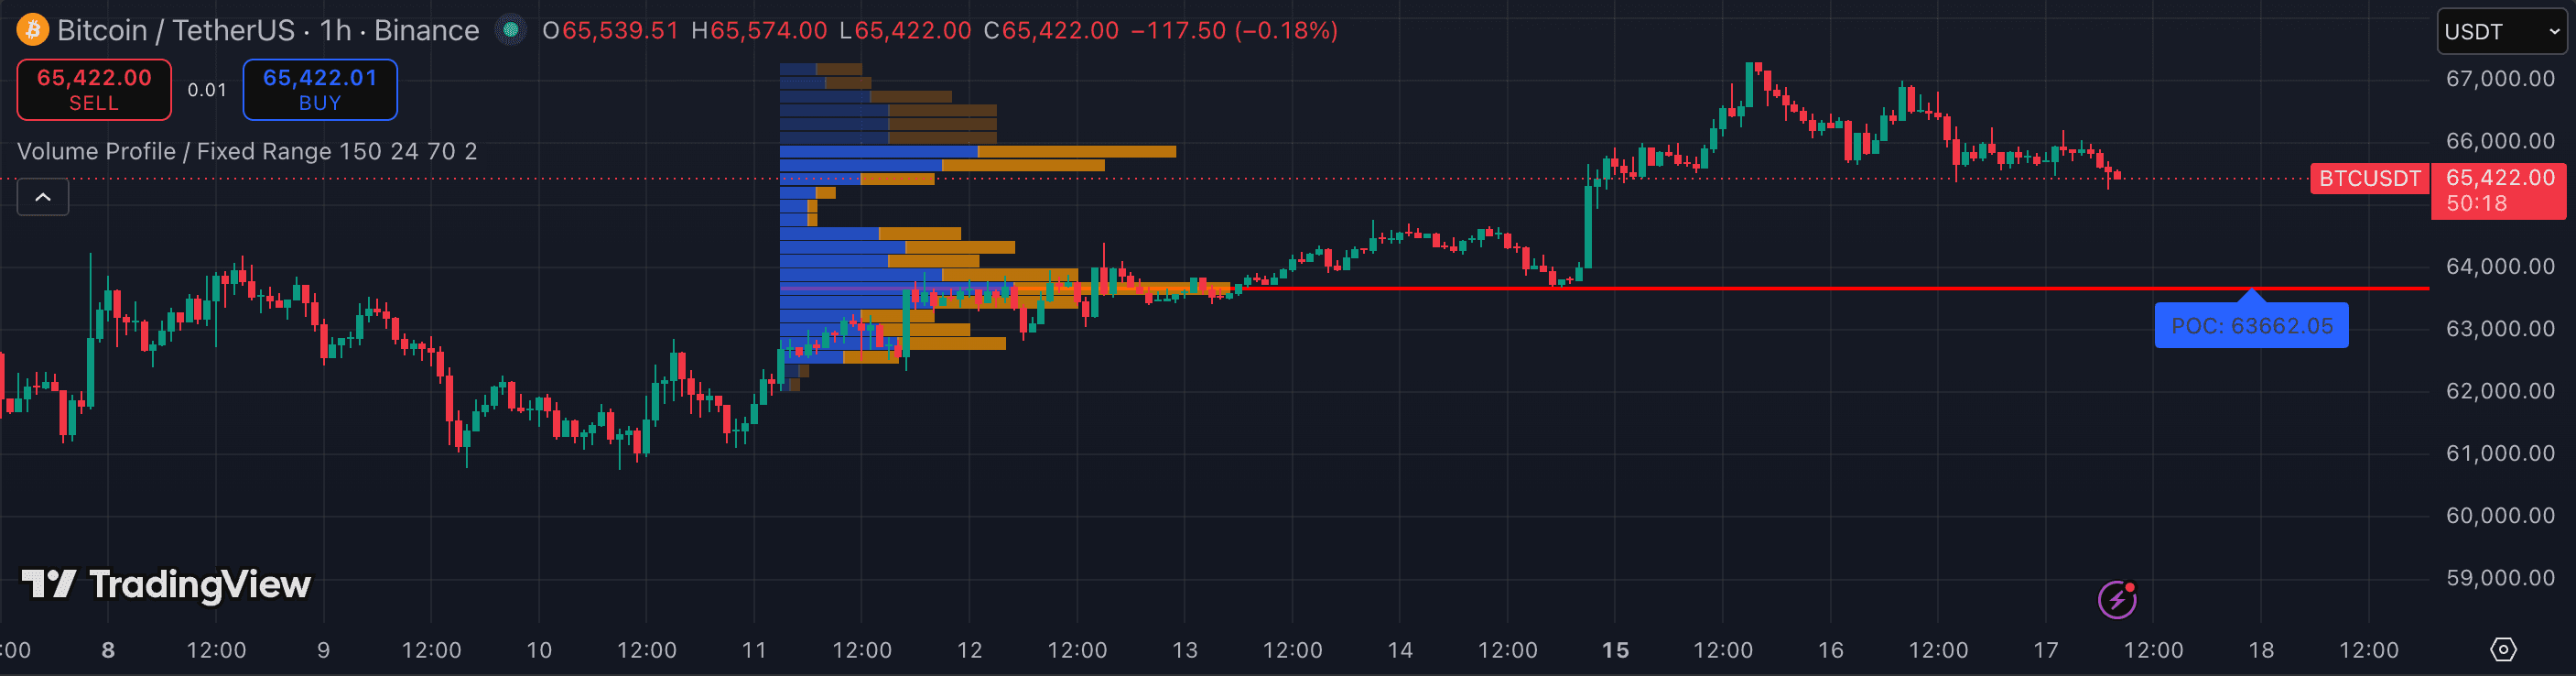
Volume Profile (Fixed Range)
volumeBuilt-inVolume Profile reveals the price levels where the most volume has changed hands — the point of control (POC) and high-volume nodes (HVNs) act as magnet prices for the underlying. Options traders use these as structural reference points for defining range boundaries and evaluating whether a strike target has structural support or resistance nearby.
Best for: Anyone trading levels, not candles·TFs:1h4h1DRead review4.7/5
The whole list, at a glance.
| # | Indicator | Category | Best timeframe | Pricing | Rating |
|---|---|---|---|---|---|
| 01 | Bollinger Bands | volatility | 15m1h4h | Built-in | 4.2/5 |
| 02 | RSI (Relative Strength Index) | momentum | 1h4h | Built-in | 4.3/5 |
| 03 | MACD | momentum | 1h4h1D | Built-in | 4.1/5 |
| 04 | ATR (Average True Range) | volatility | 15m1h4h | Built-in | 4.3/5 |
| 05 | VWAP | volume | 1m5m15m | Built-in | 4.6/5 |
| 06 | Volume Profile (Fixed Range) | volume | 1h4h1D | Built-in | 4.7/5 |
Related rankings
Not investment advice. PineRadar is an editorial directory — links may be affiliate. Always test indicators on a demo account.