— HOW IT WORKS
What Stochastic does, and when it works.
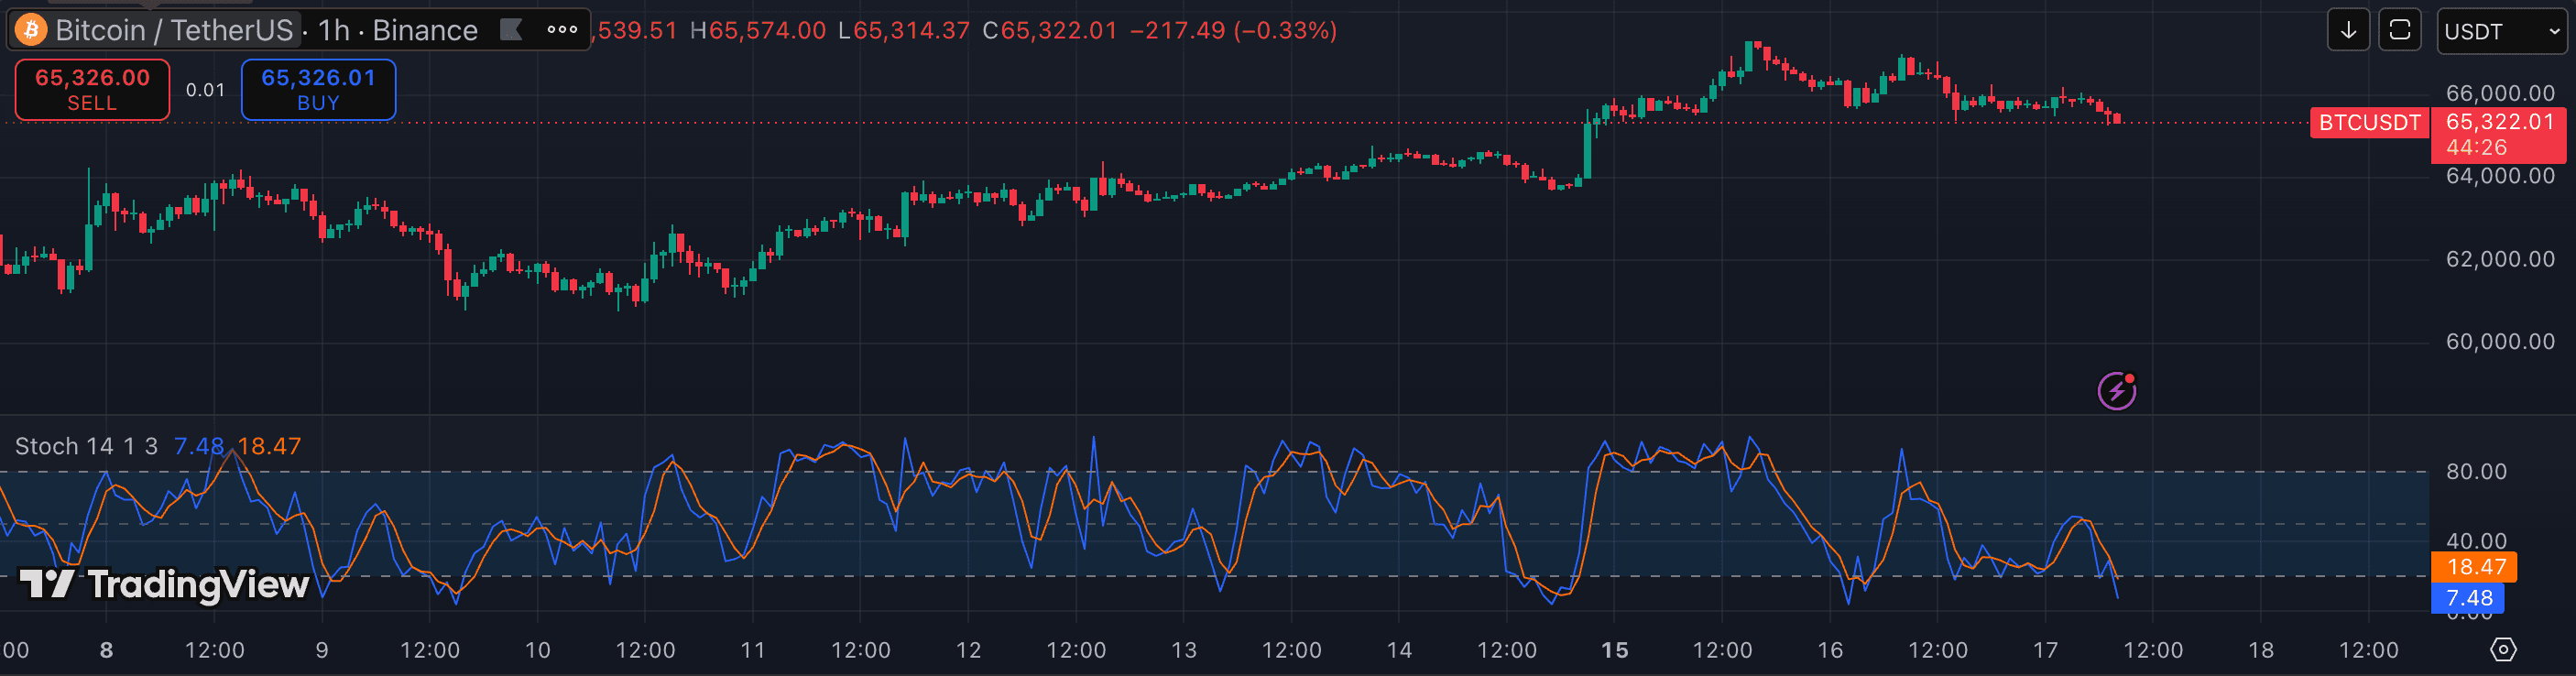
The Stochastic oscillator compares the close to the high-low range over a lookback (default 14, 3, 3) and plots two lines, %K and %D, on a 0–100 scale. Crossovers in overbought/oversold zones are the classic reversal triggers.
It is faster and noisier than RSI, which makes it strong in defined ranges and on lower timeframes where you want quick turn signals. The two-line structure gives a confluence read that single-line oscillators lack.
In strong trends Stochastic fires wrong reversal after wrong reversal. Use it where price is range-bound, not trending.
— BEST FOR
Where it earns its slot.
cryptomomentumscalping