— HOW IT WORKS
What MACD does, and when it works.
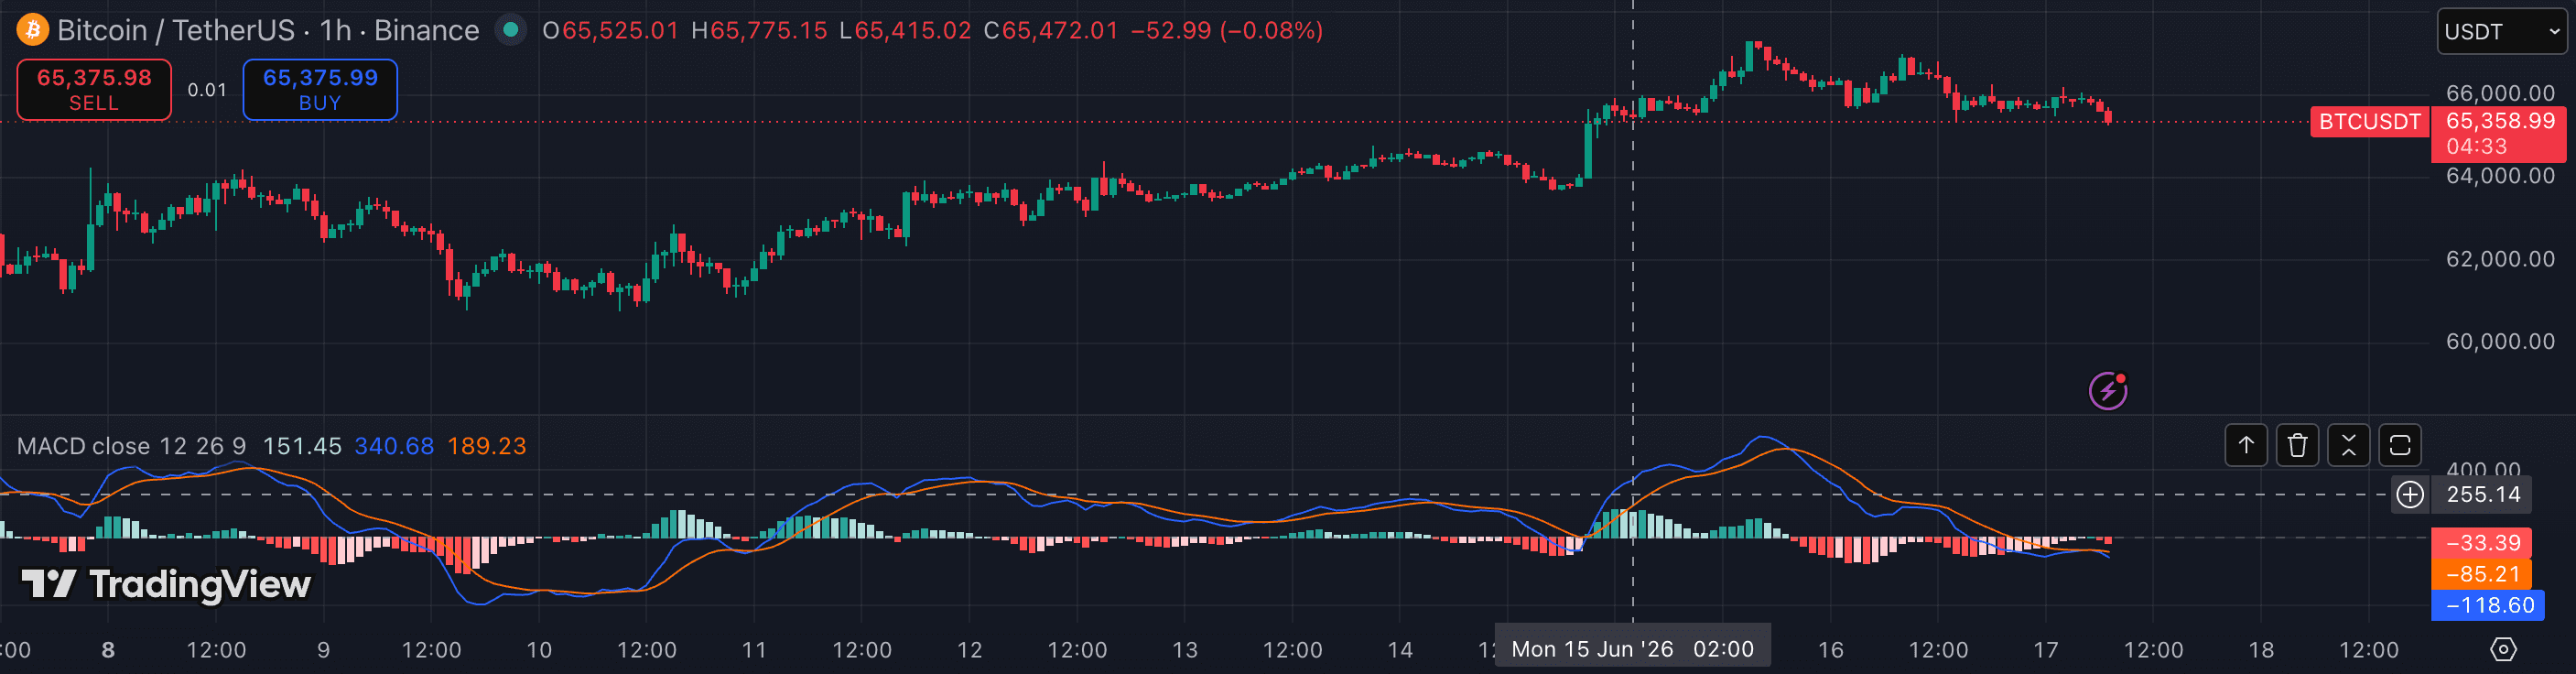
MACD subtracts a slow EMA from a fast EMA (default 12/26) and plots a signal line (9) plus a histogram. Crossovers of the MACD line and signal line are the headline 'golden/death cross' signals; the histogram shows momentum building or fading.
It is genuinely two tools in one: the line cross gives trend timing, while the zero-line tells you which side of momentum you're on. The histogram is the early-warning system — it shrinks before crosses happen.
MACD lags by design and crosses constantly in ranges. It shines on 1h–4h crypto trends and is best filtered by a higher-timeframe bias.
— BEST FOR
Where it earns its slot.
cryptomomentumbeginnerstrend