— HOW IT WORKS
What RSI does, and when it works.
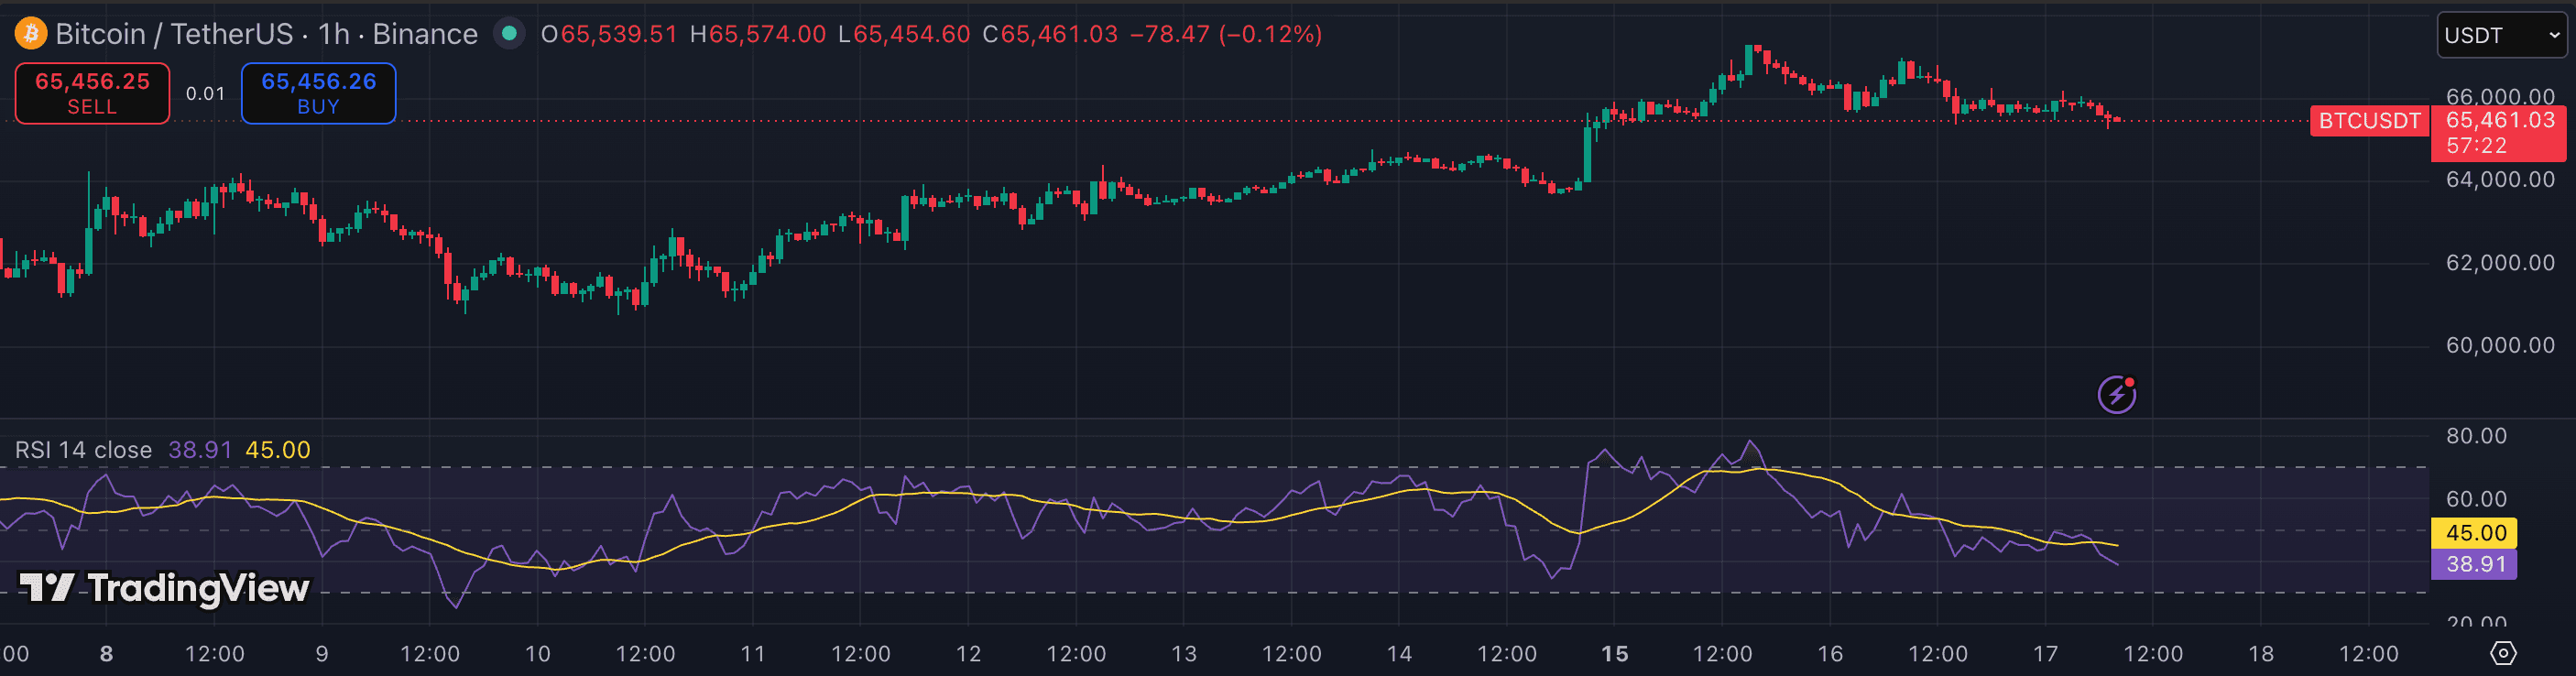
RSI measures the speed and magnitude of recent price changes on a 0–100 scale. Readings above 70 are conventionally 'overbought' and below 30 'oversold', but in trends those thresholds bend — strong crypto rallies sit pinned above 70 for days.
The more durable use is divergence: price makes a higher high while RSI makes a lower high, hinting the move is running out of fuel. On BTC/ETH 1h and above this is one of the more reliable reversal tells available.
Avoid trading RSI extremes against a strong trend. It is an exhaustion gauge, not a reversal guarantee.
— BEST FOR
Where it earns its slot.
cryptomomentumbeginnersswing-trading