Best TradingView indicators for position trading in crypto
Position trading means holding for weeks or months, riding macro trends while ignoring daily noise. The indicators that serve you here are not the same as those for day-trading: you need tools that capture macro trend direction, confirm multi-week momentum, and alert you when a structural shift — not just a retest — is actually underway. This list focuses on the indicators most useful on the 1D and 1W timeframes for crypto position traders.
- 01RANK
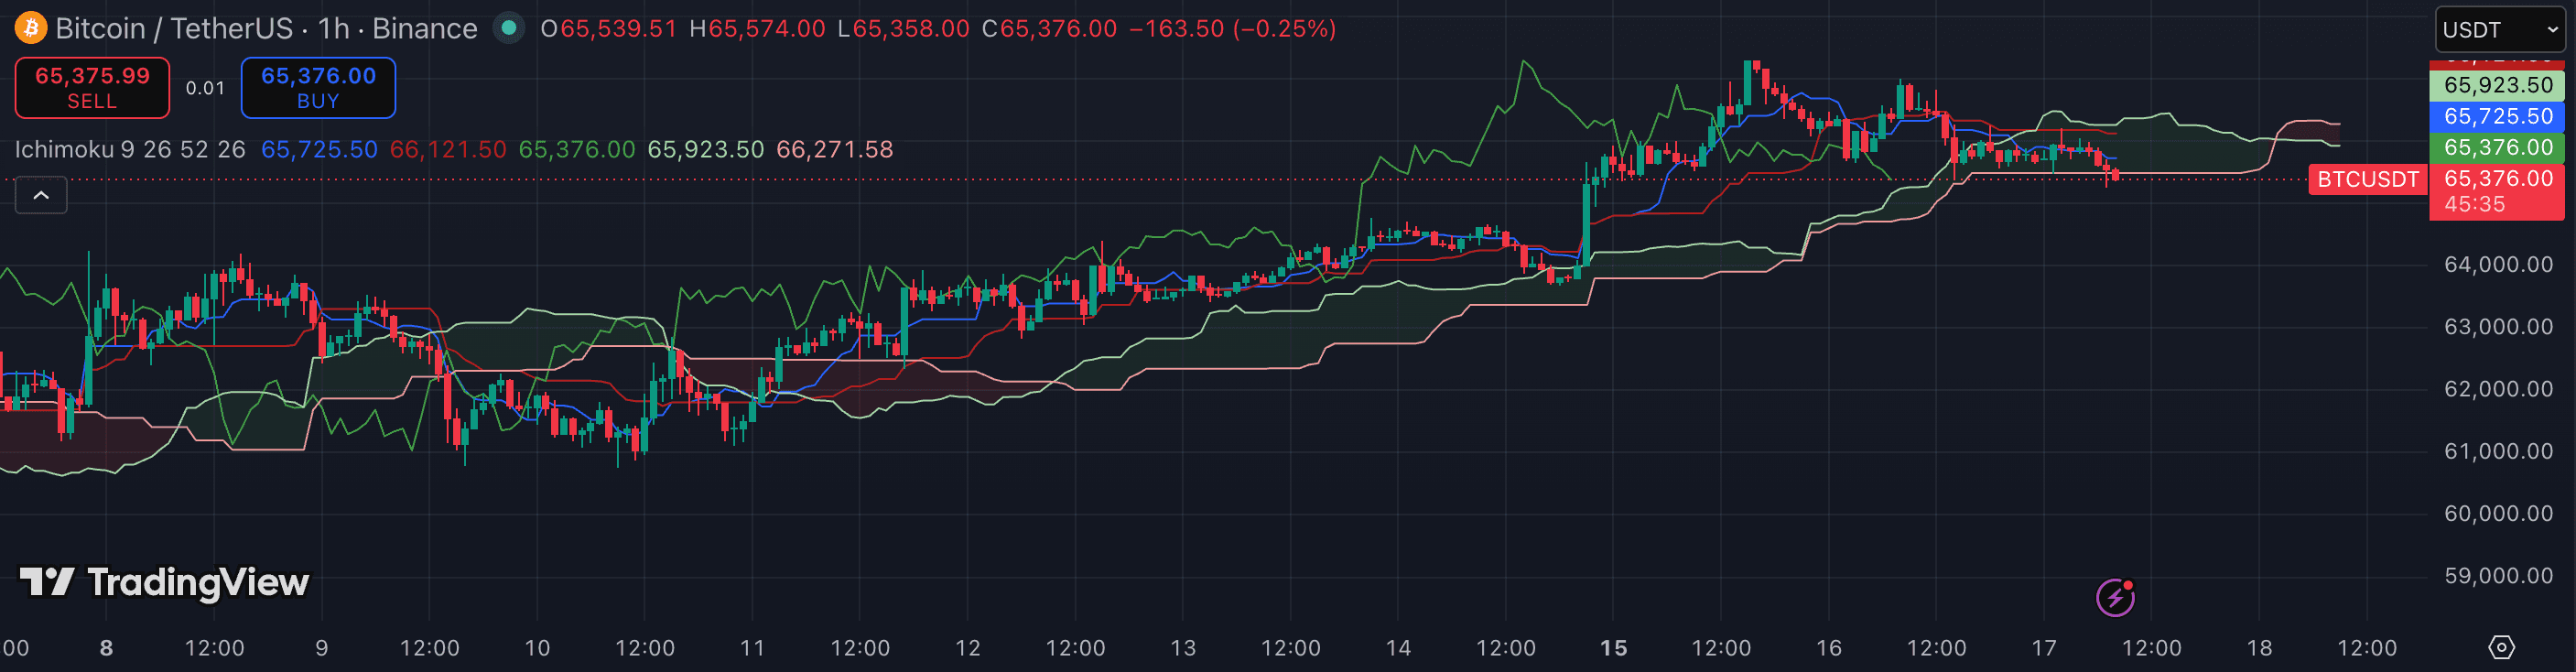
Ichimoku Cloud
trendBuilt-inOn the daily and weekly chart, Ichimoku provides a complete trend picture in a single glance: the cloud colour signals macro bias, TK cross confirms entry or exit momentum, and the Chikou Span gives a clean structural confirmation. When price is above a bullish (green) cloud on 1D, the bias for position long trades is clear without constant re-evaluation.
Best for: Swing traders wanting one all-in-one overlay·TFs:4h1D1WRead review4.2/5 - 02RANK
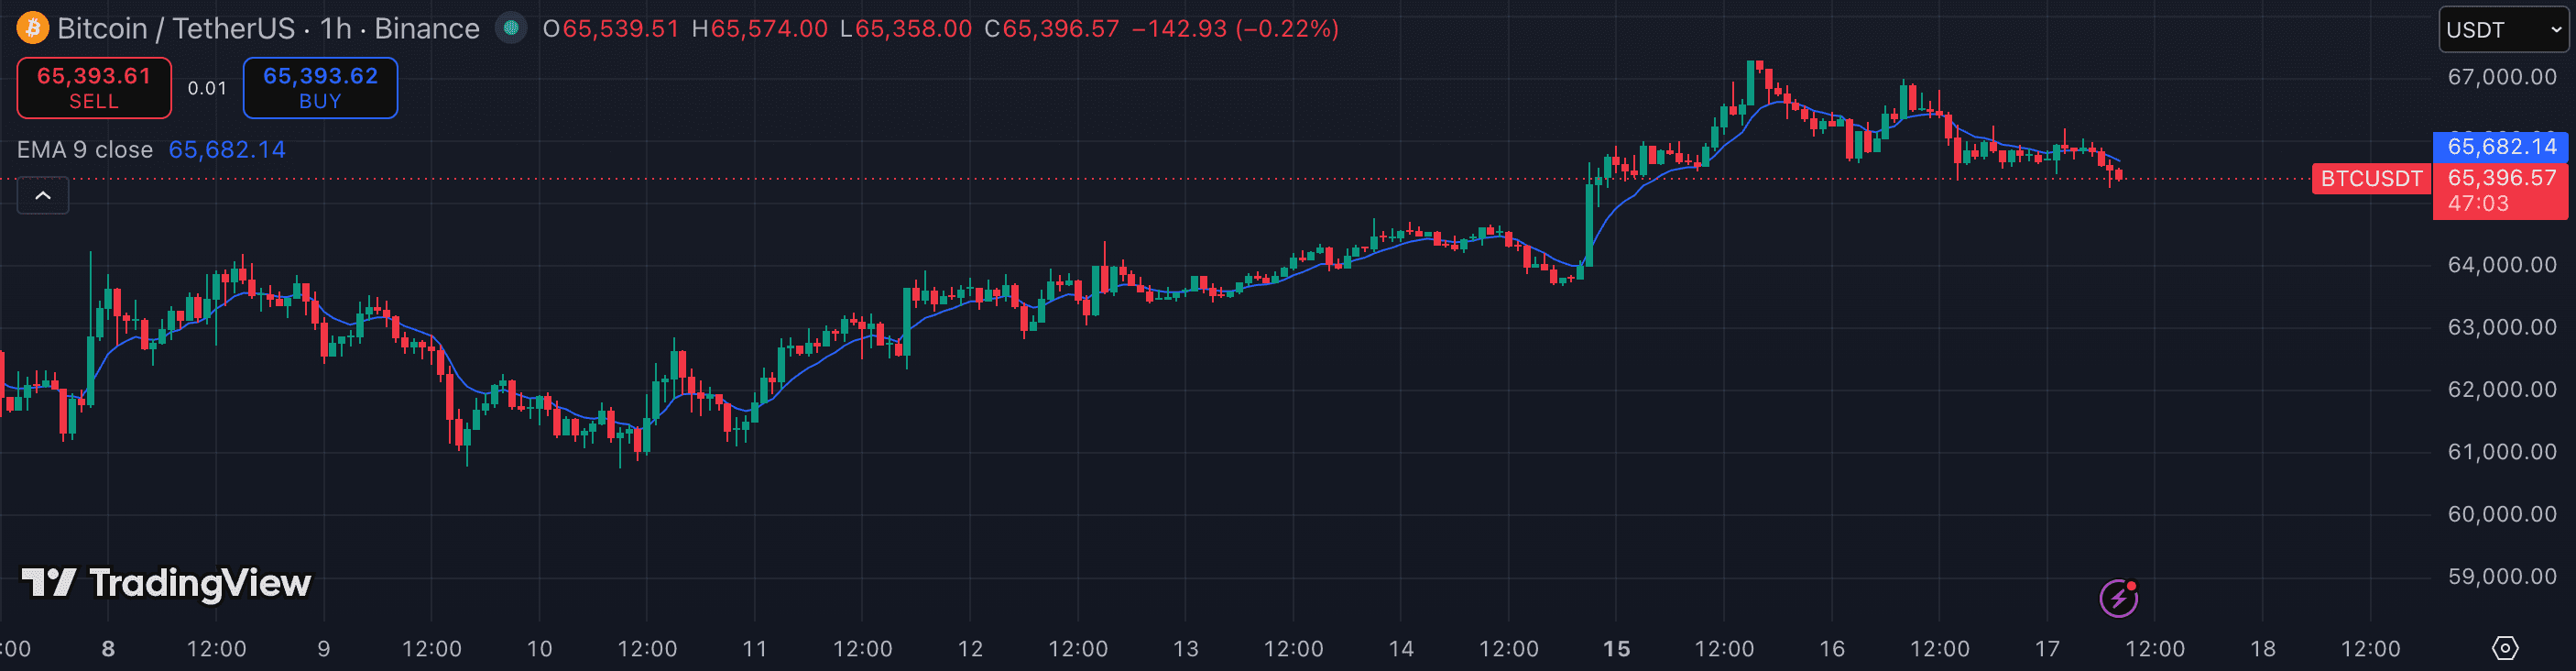
Moving Average (EMA/SMA)
trendBuilt-inThe 20/50/200-period EMAs form the backbone of position-trading analysis. The 200-period EMA on the daily chart is the single most-watched line in crypto: sustained price above it separates bull-market positioning from bear-market exposure. Death cross (50 below 200) and golden cross (50 above 200) are the coarse regime switches that position traders act on.
Best for: Anyone who needs a simple, reliable trend bias·TFs:15m1h4hRead review4.2/5 - 03RANK
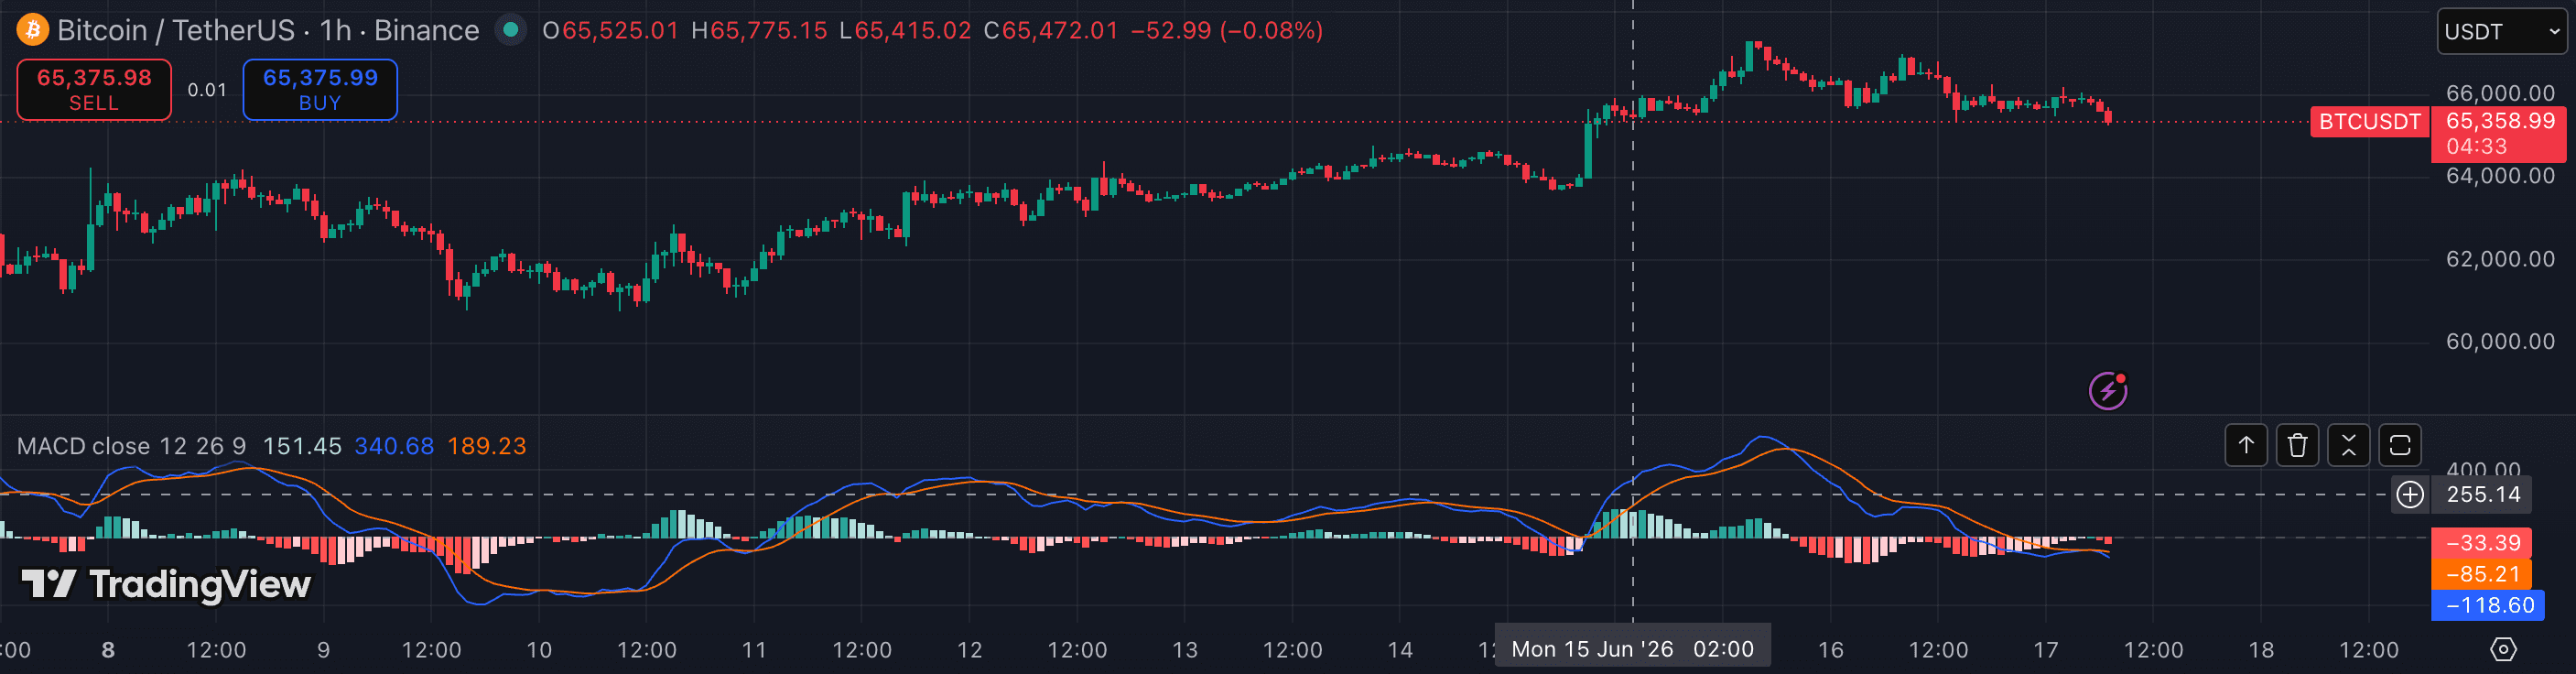
MACD
momentumBuilt-inWeekly MACD histogram direction is a reliable macro momentum filter. A histogram that is rising above the zero line on the 1W chart confirms that buying pressure is expanding over a multi-week window — the right condition to add to a position. Histogram turns negative before price peaks are often the first warning of a macro regime shift.
Best for: Traders who want trend and momentum on one pane·TFs:1h4h1DRead review4.1/5 - 04RANK
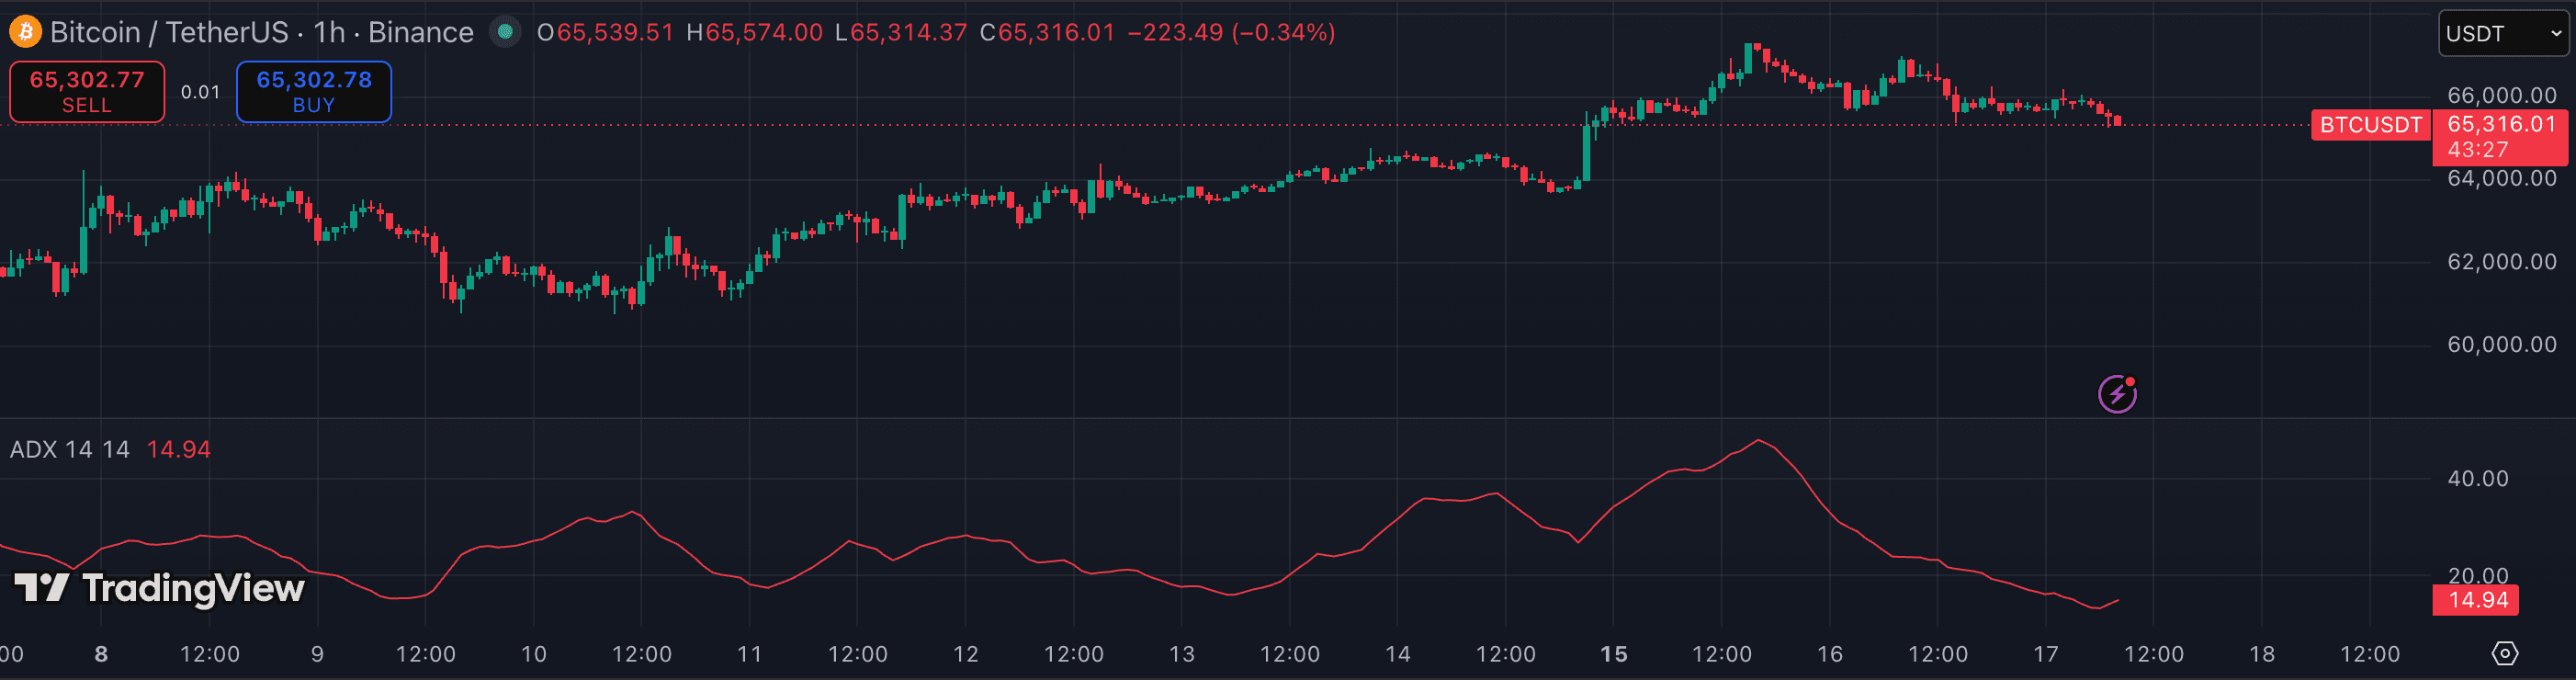
ADX (Average Directional Index)
trendBuilt-inADX above 25 on the daily or weekly chart means a trend is strong enough to hold through normal pullbacks. Position traders use ADX as a conviction filter: only run full-size long exposure when ADX is trending up and above 25. An ADX turning down from above 40 is a classic signal to begin trimming.
Best for: Trend traders who want a chop filter·TFs:1h4h1DRead review4.1/5 - 05RANK
RSI (Relative Strength Index)
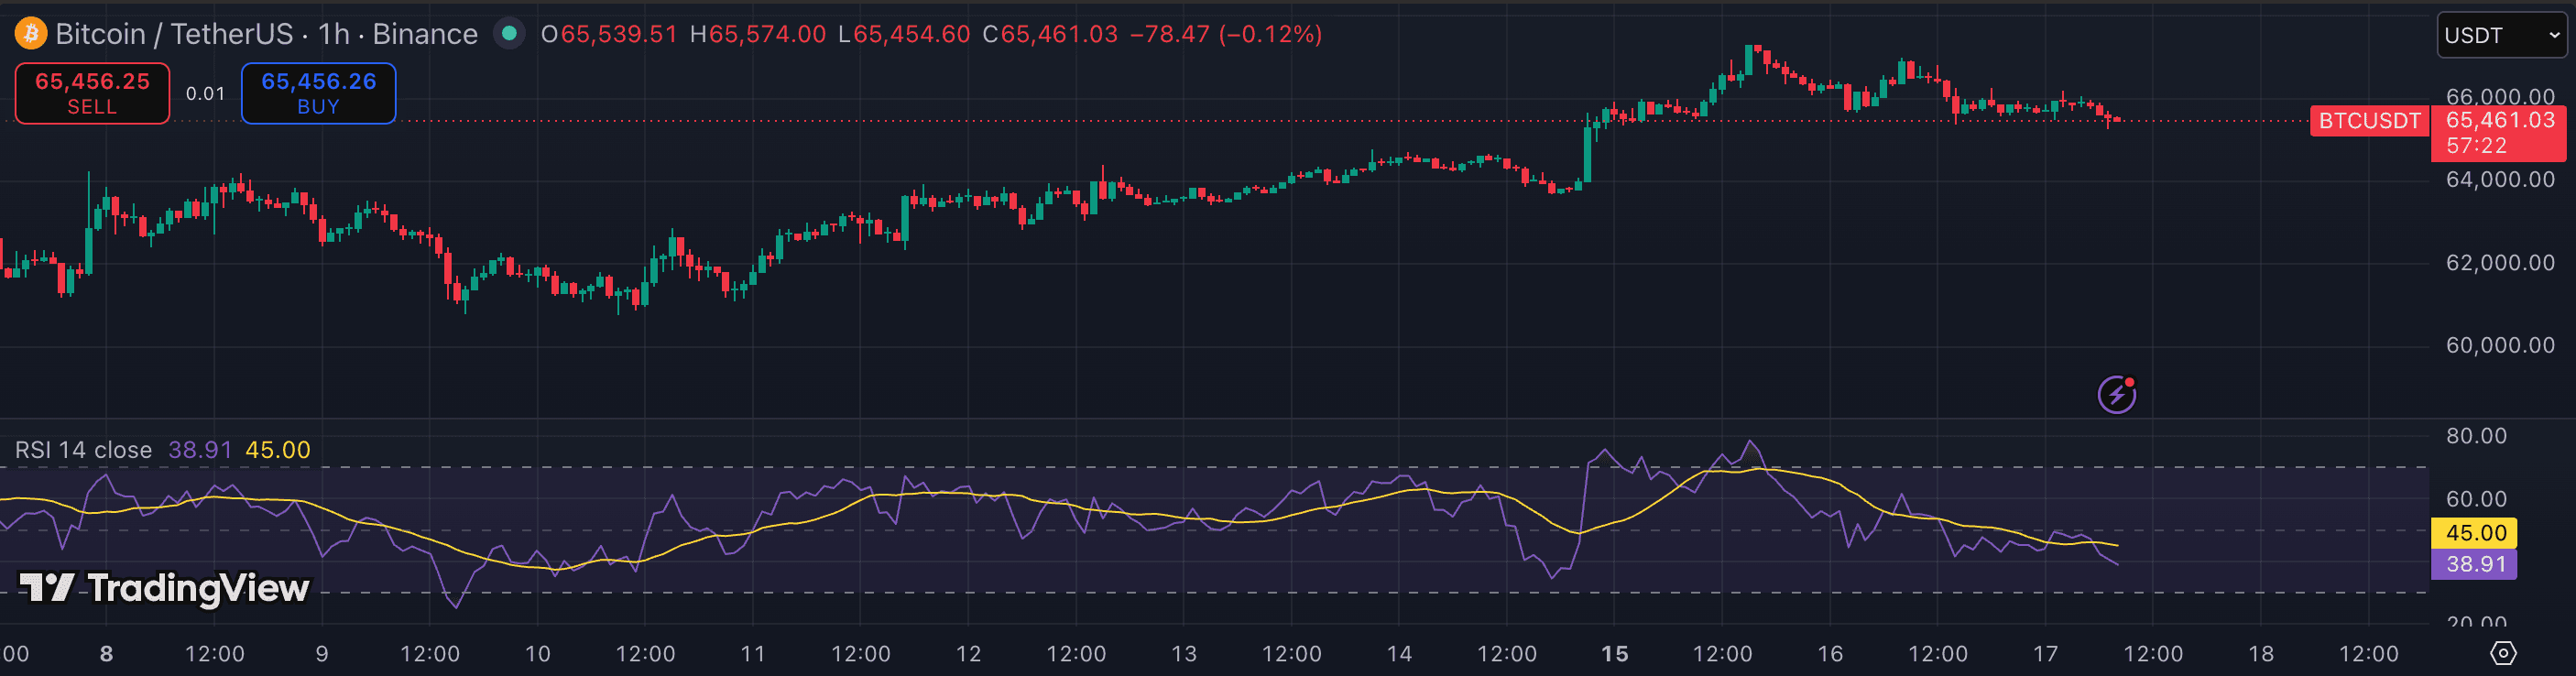
momentumBuilt-inOn 1W, RSI below 40 has historically marked deeply discounted zones in BTC and major altcoins, while readings above 70 for multiple weekly closes have coincided with macro top formations. Position traders use weekly RSI not as a timing tool but as a valuation gauge — a structurally oversold weekly RSI is a reason to begin accumulation, not panic.
Best for: Swing entries on BTC/ETH 1h+·TFs:1h4hRead review4.3/5 - 06RANK
Volume Profile (Fixed Range)
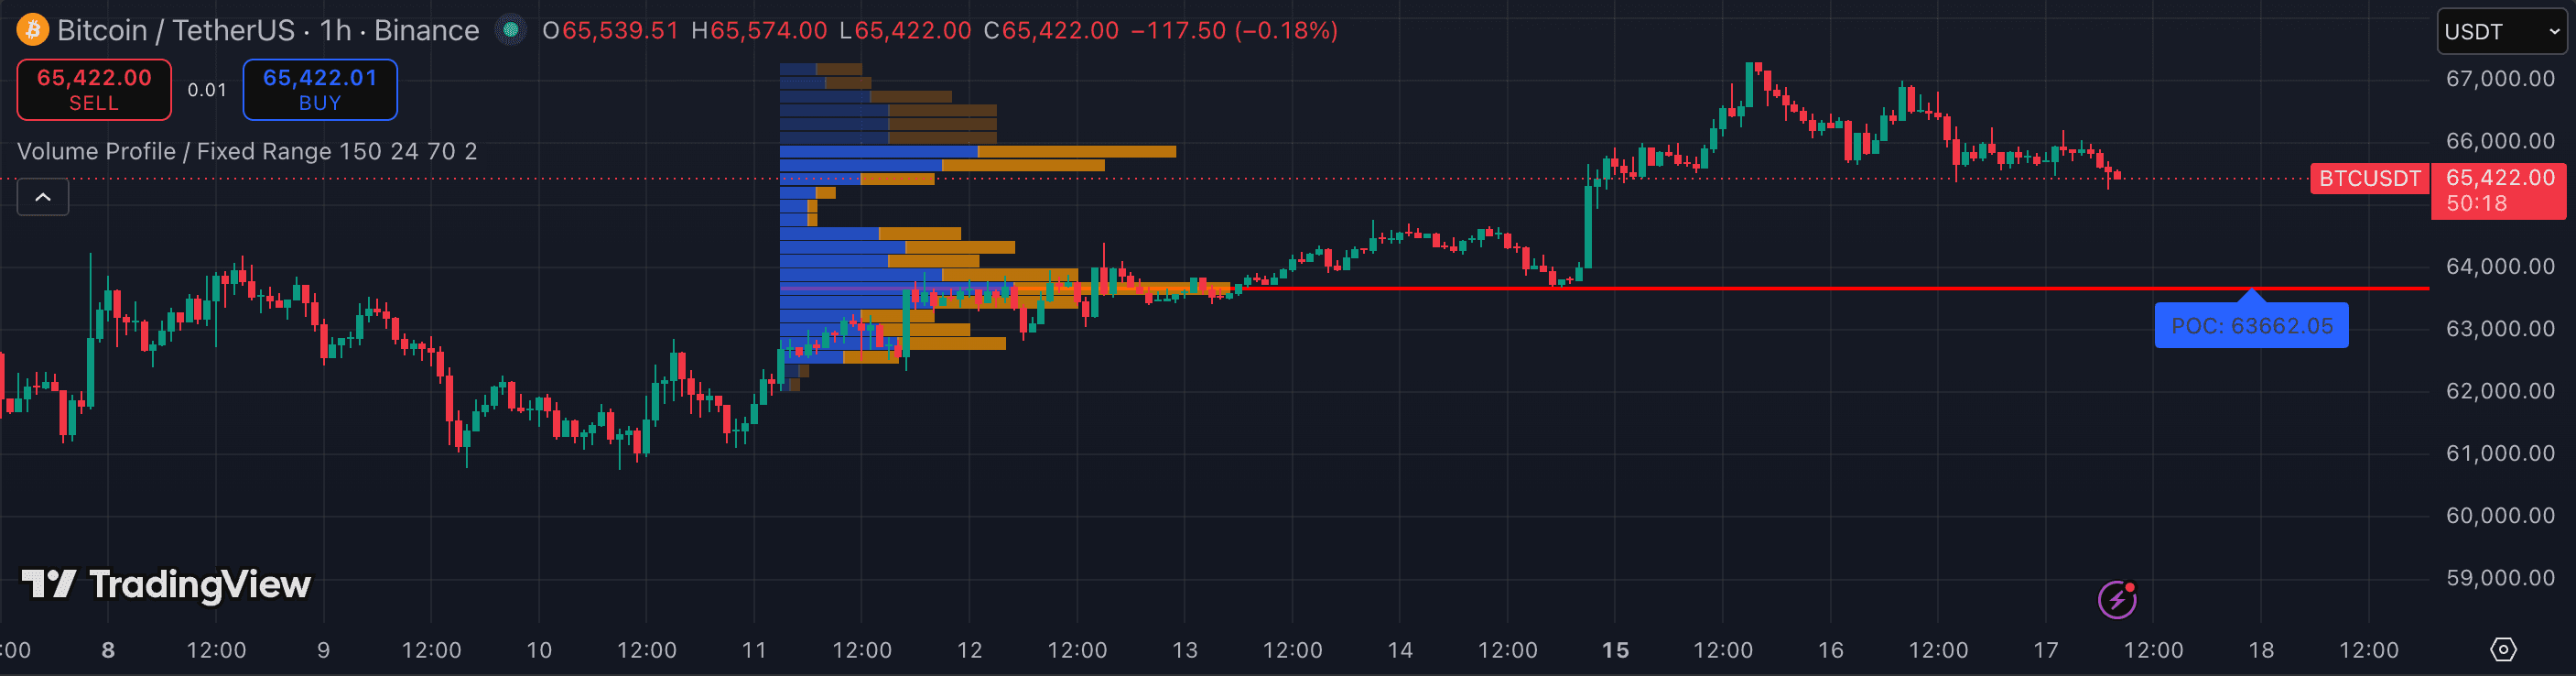
volumeBuilt-inThe fixed-range volume profile over a prior major swing high or low shows exactly where the market has done the most work — the high-volume nodes are the levels where price tends to stall or reverse on the next visit. Position traders use these nodes to set limit entries on pullbacks and define key invalidation points.
Best for: Anyone trading levels, not candles·TFs:1h4h1DRead review4.7/5 - 07RANK
Heikin Ashi
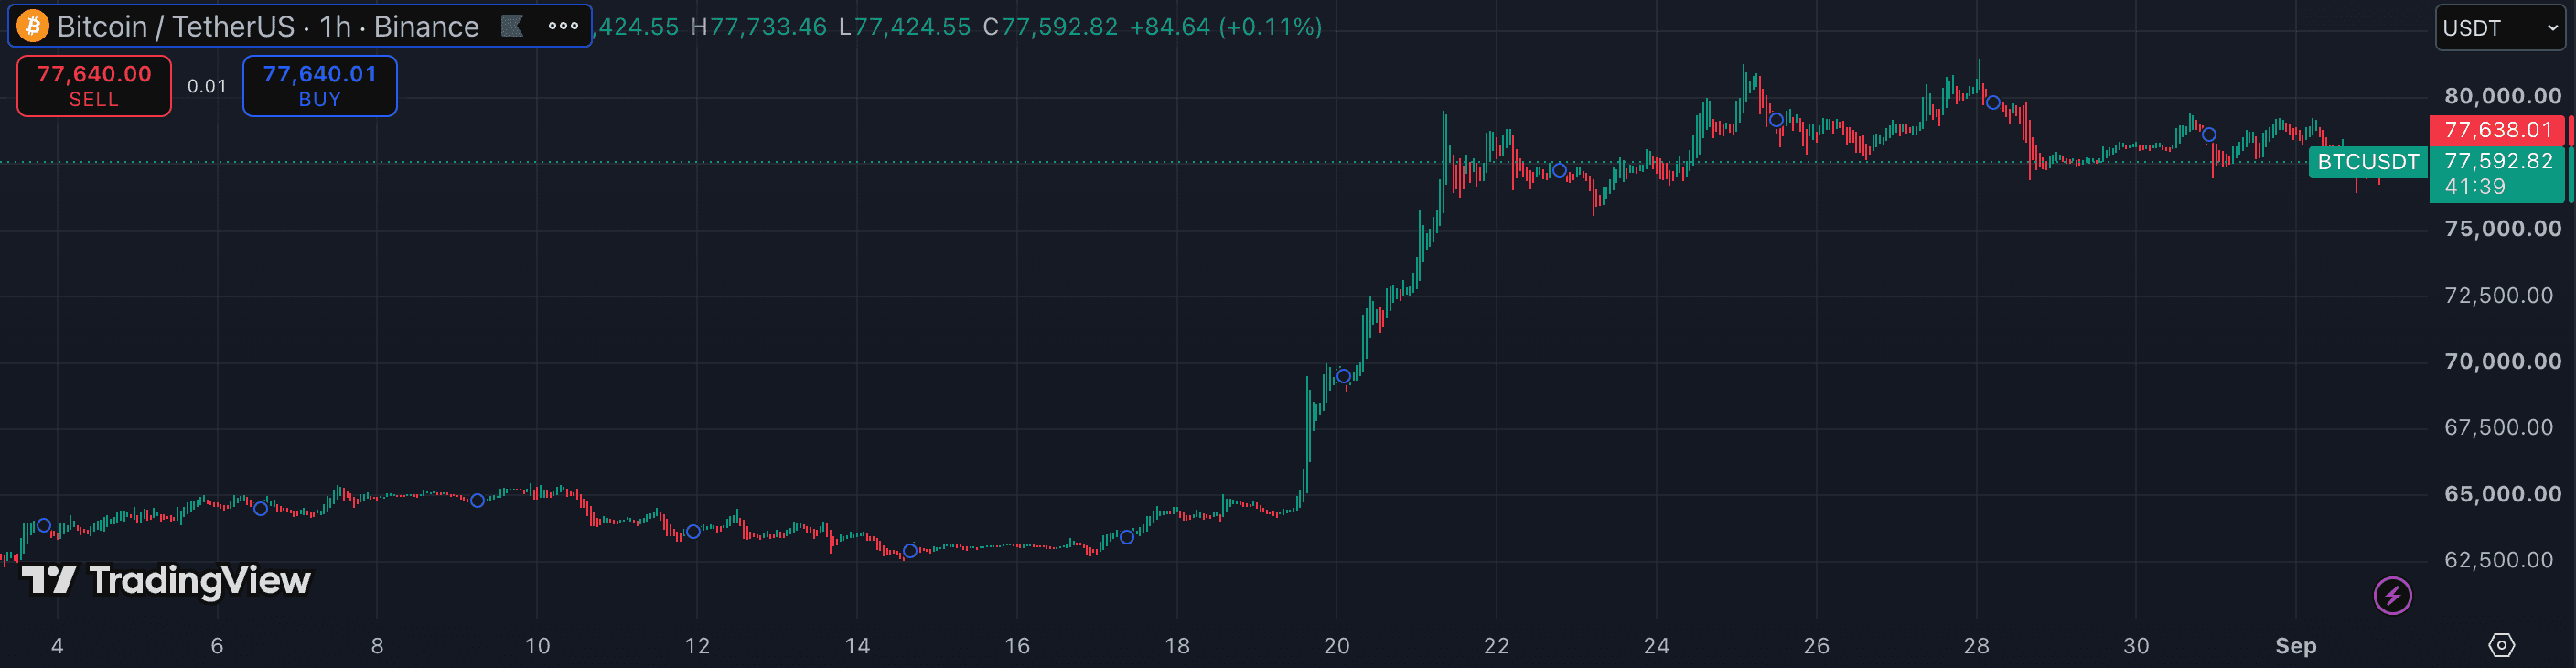
trendBuilt-inPosition traders hold through multi-week noise that shakes out shorter-term participants. Heikin Ashi's averaged candle series filters that noise into clean trend runs — making it far easier to stay in a position through normal volatility without misreading a routine pullback as a reversal. Use HA for trend context; reference standard candles for actual entry and stop levels.
Best for: Swing and position traders who want cleaner trend reads without indicator clutter·TFs:1h4h1DRead review4.1/5
The whole list, at a glance.
| # | Indicator | Category | Best timeframe | Pricing | Rating |
|---|---|---|---|---|---|
| 01 | Ichimoku Cloud | trend | 4h1D1W | Built-in | 4.2/5 |
| 02 | Moving Average (EMA/SMA) | trend | 15m1h4h | Built-in | 4.2/5 |
| 03 | MACD | momentum | 1h4h1D | Built-in | 4.1/5 |
| 04 | ADX (Average Directional Index) | trend | 1h4h1D | Built-in | 4.1/5 |
| 05 | RSI (Relative Strength Index) | momentum | 1h4h | Built-in | 4.3/5 |
| 06 | Volume Profile (Fixed Range) | volume | 1h4h1D | Built-in | 4.7/5 |
| 07 | Heikin Ashi | trend | 1h4h1D | Built-in | 4.1/5 |
Related rankings
Not investment advice. PineRadar is an editorial directory — links may be affiliate. Always test indicators on a demo account.