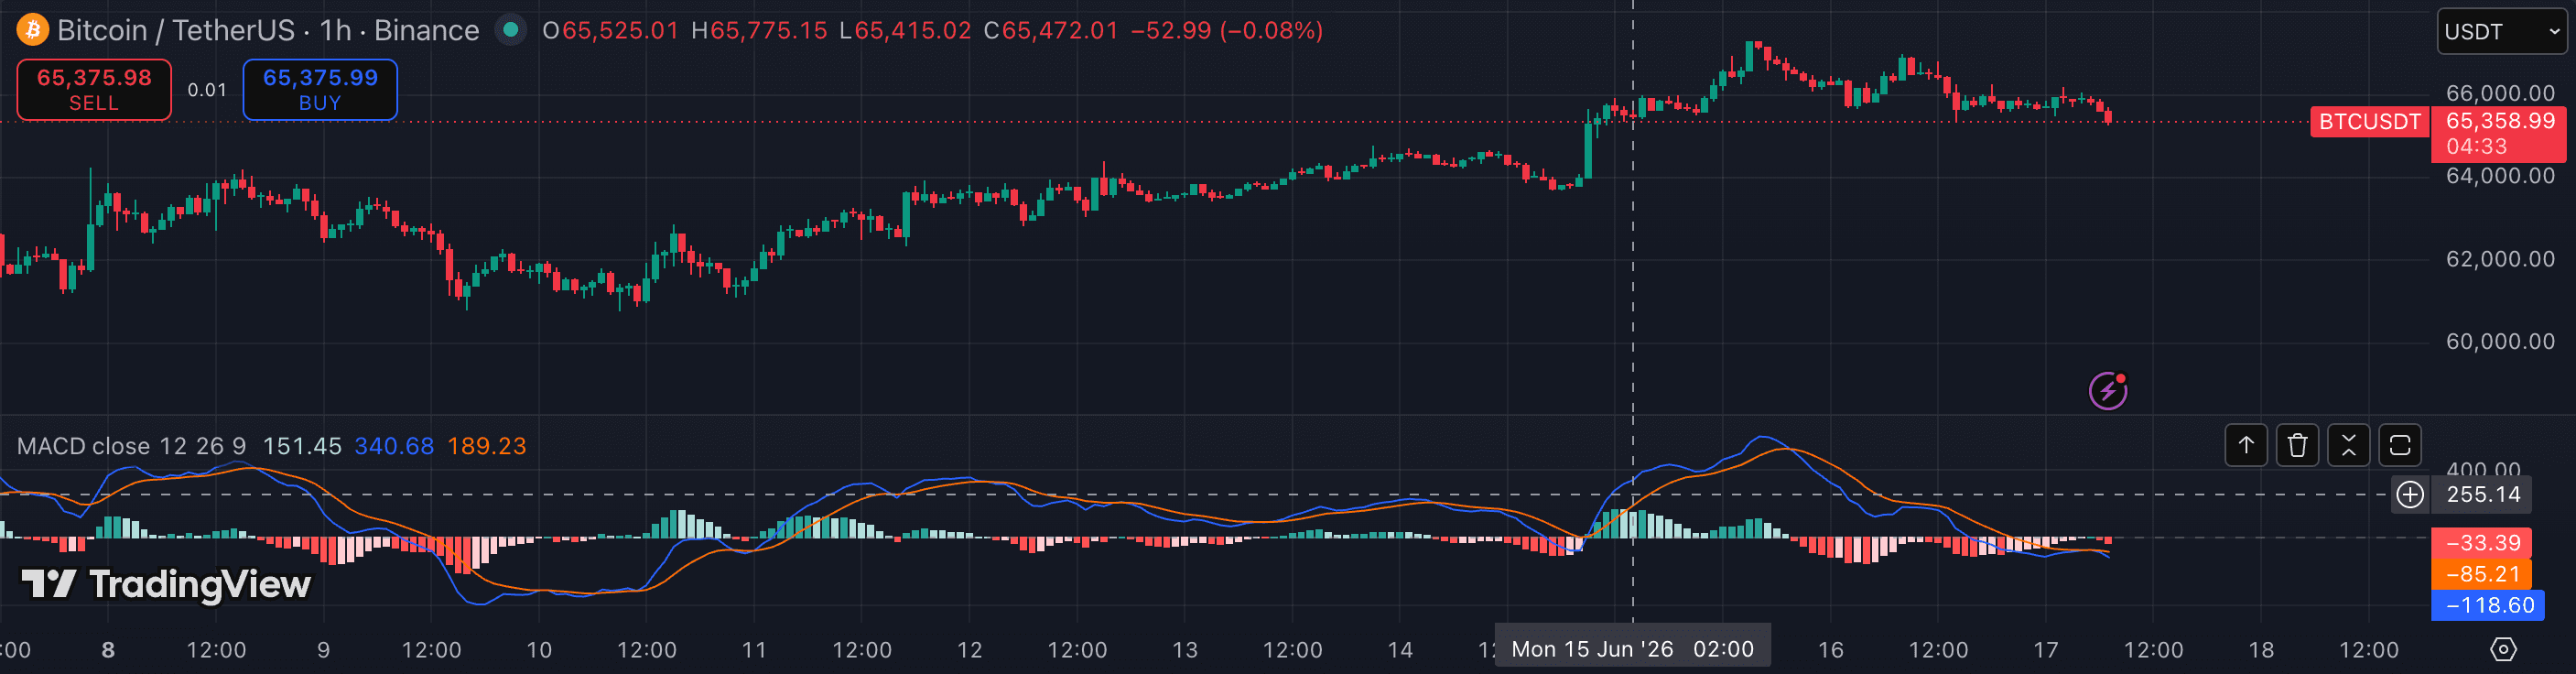
MACD's default settings (12-period fast EMA, 26-period slow EMA, 9-period signal line) were designed for daily equity charts in the 1970s. Crypto markets run 24/7, move faster, and have different volatility profiles — which means the defaults often lag or fire too many false signals. This guide covers how the settings work, what each parameter actually changes, and which configurations experienced crypto traders use for different timeframes and styles. No setting is universally 'best' — the right parameters depend on your timeframe and what you're using MACD for.
1. Understand what each parameter controls
MACD has three parameters: the fast EMA period (default 12), the slow EMA period (default 26), and the signal line period (default 9). The MACD line itself is fast EMA minus slow EMA. The signal line is a smoothed average of the MACD line. The histogram shows the distance between them.
Reducing either EMA period makes MACD react faster but produces more crossings, many of which will be noise. Increasing the periods makes the indicator slower and smoother, reducing false signals but introducing more lag. The signal line period controls how smooth the trigger is — a shorter signal line reacts faster but produces choppier crossings.
2. Use the defaults on 4h and daily for trend identification
On the 4h and daily charts, the default 12/26/9 remains a reliable trend-identification tool for crypto. The lag that makes it problematic on lower timeframes becomes an asset on higher timeframes — you avoid getting whipsawed by short-term volatility, and the signals that do fire tend to represent genuine trend changes.
On BTC and ETH daily charts, the 12/26/9 MACD zero-line cross (MACD line crossing above or below zero, not just the signal line) has historically been a clean directional bias indicator. Use zero-line position to determine trend direction and signal-line crossings only for entry timing.
3. Apply faster settings on 1h charts
For 1h crypto charts, traders commonly reduce periods to 8/21/5 or 9/21/7. These shorter periods adapt better to intraday crypto volatility. The 8/21 combination references the Fibonacci sequence, which many traders find produces cleaner visual structure on the 1h.
The 3/10/16 setting (sometimes called the 'MACD 3-10 oscillator' or 'blau's MACD') is another option used specifically for momentum reading rather than crossings — the shorter periods make it react quickly to price movement, but it generates many more crosses and requires structure context to filter.
4. Slow down for swing trading on daily and weekly charts
For swing traders who hold positions for days to weeks, the 20/50/9 or 26/52/9 settings reduce false signals on daily charts. The 26/52/9 is particularly common among traders who use weekly charts as their primary timeframe — the 52-period slow EMA covers roughly one year of weekly data, making the zero-line cross a genuine long-term trend signal.
On daily BTC charts, the 26/52/9 zero-line cross has historically aligned with major trend phases. This setting lags significantly on entry but makes up for it by avoiding the many false reversals the default settings fire in range-bound periods.
5. Filter all MACD signals with zero-line context
Regardless of the settings you choose, the most important filter for MACD in crypto is the zero-line position. A bullish signal-line cross while the MACD line is above zero (both lines above zero) is a different trade quality than a bullish cross while the MACD line is deeply below zero recovering. The first is a momentum continuation in an established trend; the second is a potential reversal from a depressed level.
Only take bullish crossings when MACD is above zero (or crossing zero from below on a strong move). Only take bearish crossings when MACD is below zero (or crossing zero from above). This single rule eliminates a large portion of the false signals that make MACD frustrating for new traders.
- Trading every signal-line cross without checking the zero-line position — crosses below zero for longs and above zero for shorts have much lower follow-through.
- Using 12/26/9 on 5m or 15m charts where the lag makes every cross late and the signals are almost entirely noise.
- Changing settings repeatedly after a losing trade — parameter optimisation on recent history leads to overfit settings that stop working going forward.
- Ignoring the histogram and only watching the line cross — the histogram's direction change often leads the actual line cross by one or two bars.
- Using MACD as the sole entry trigger without any structure context — a MACD cross into a key resistance level is a very different quality from one in open space.