The best TradingView indicators for trading a crypto bull market
Bull markets punish hesitation and reward riding momentum. The challenge shifts from 'is this a real move?' to 'how do I stay in without getting shaken out?' These indicators are the most useful for confirming trend strength, timing entries on pullbacks, and managing positions through the inevitable retracements. Educational content only; not investment advice.
- 01RANK
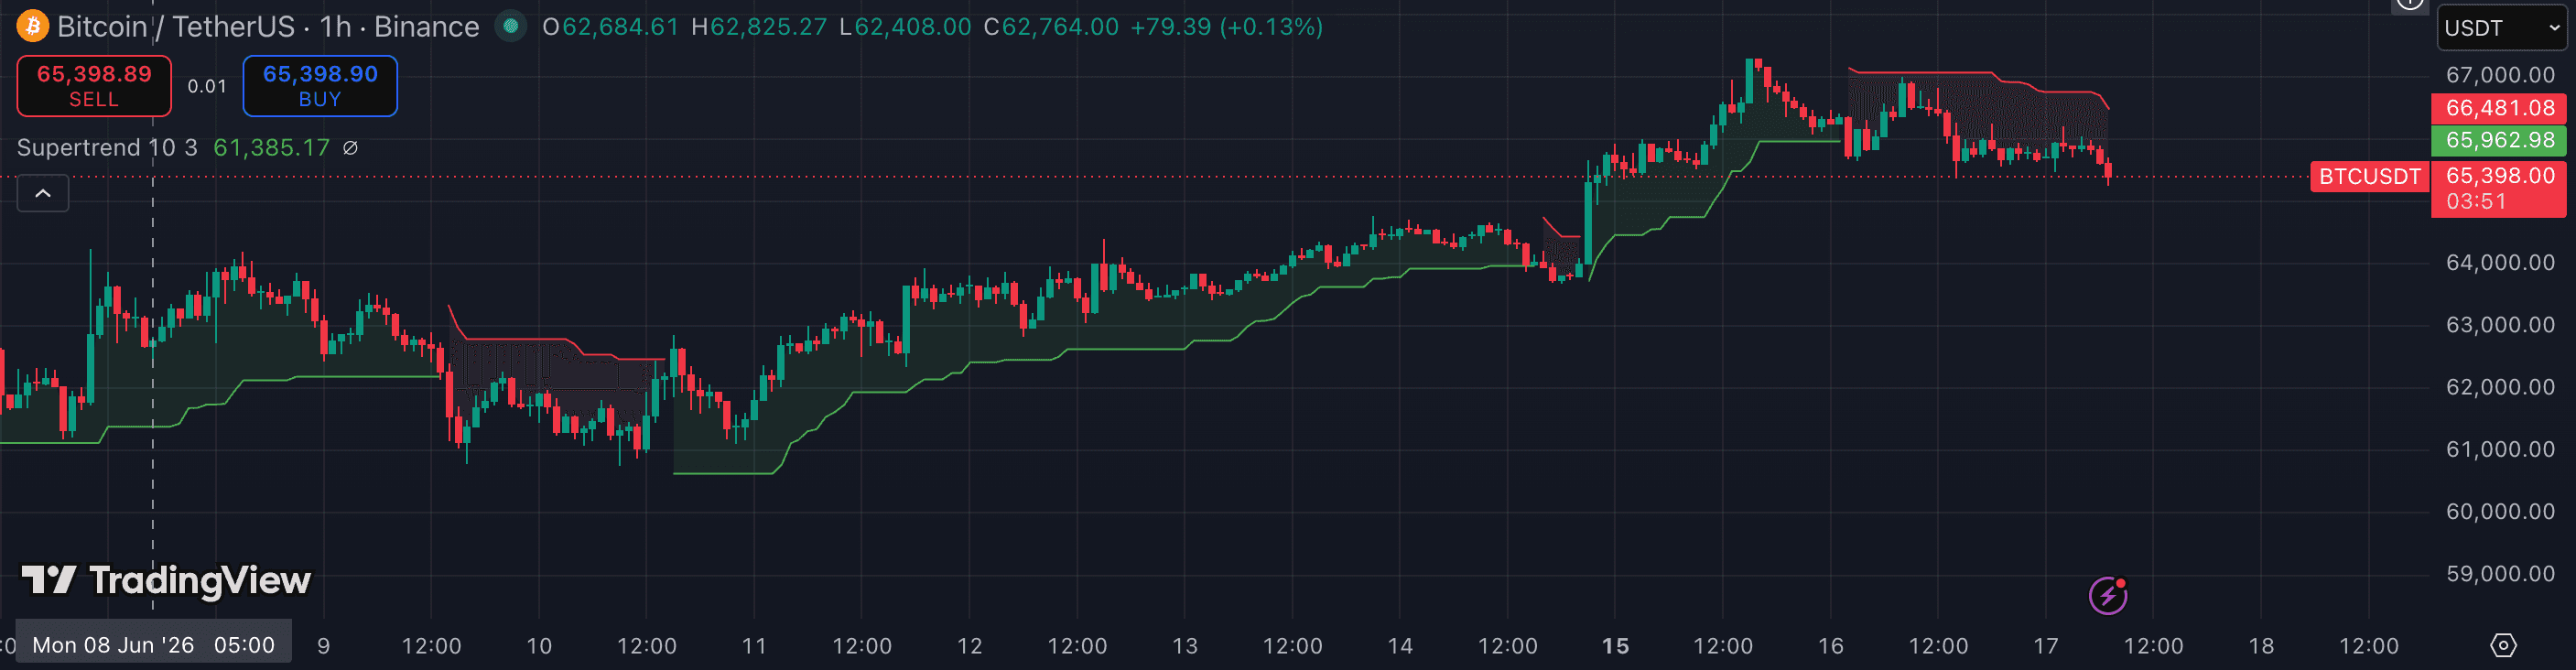
Supertrend
trendFreeIn a bull market, Supertrend's ATR-based trailing line provides a clean mechanical anchor: as long as price stays above the line, the uptrend is intact. It doubles as a trailing stop and automatically widens during high-volatility legs, preventing normal retracements from triggering premature exits.
Best for: Trend-followers tired of MA spaghetti·TFs:15m1h4hRead review4.6/5 - 02RANK
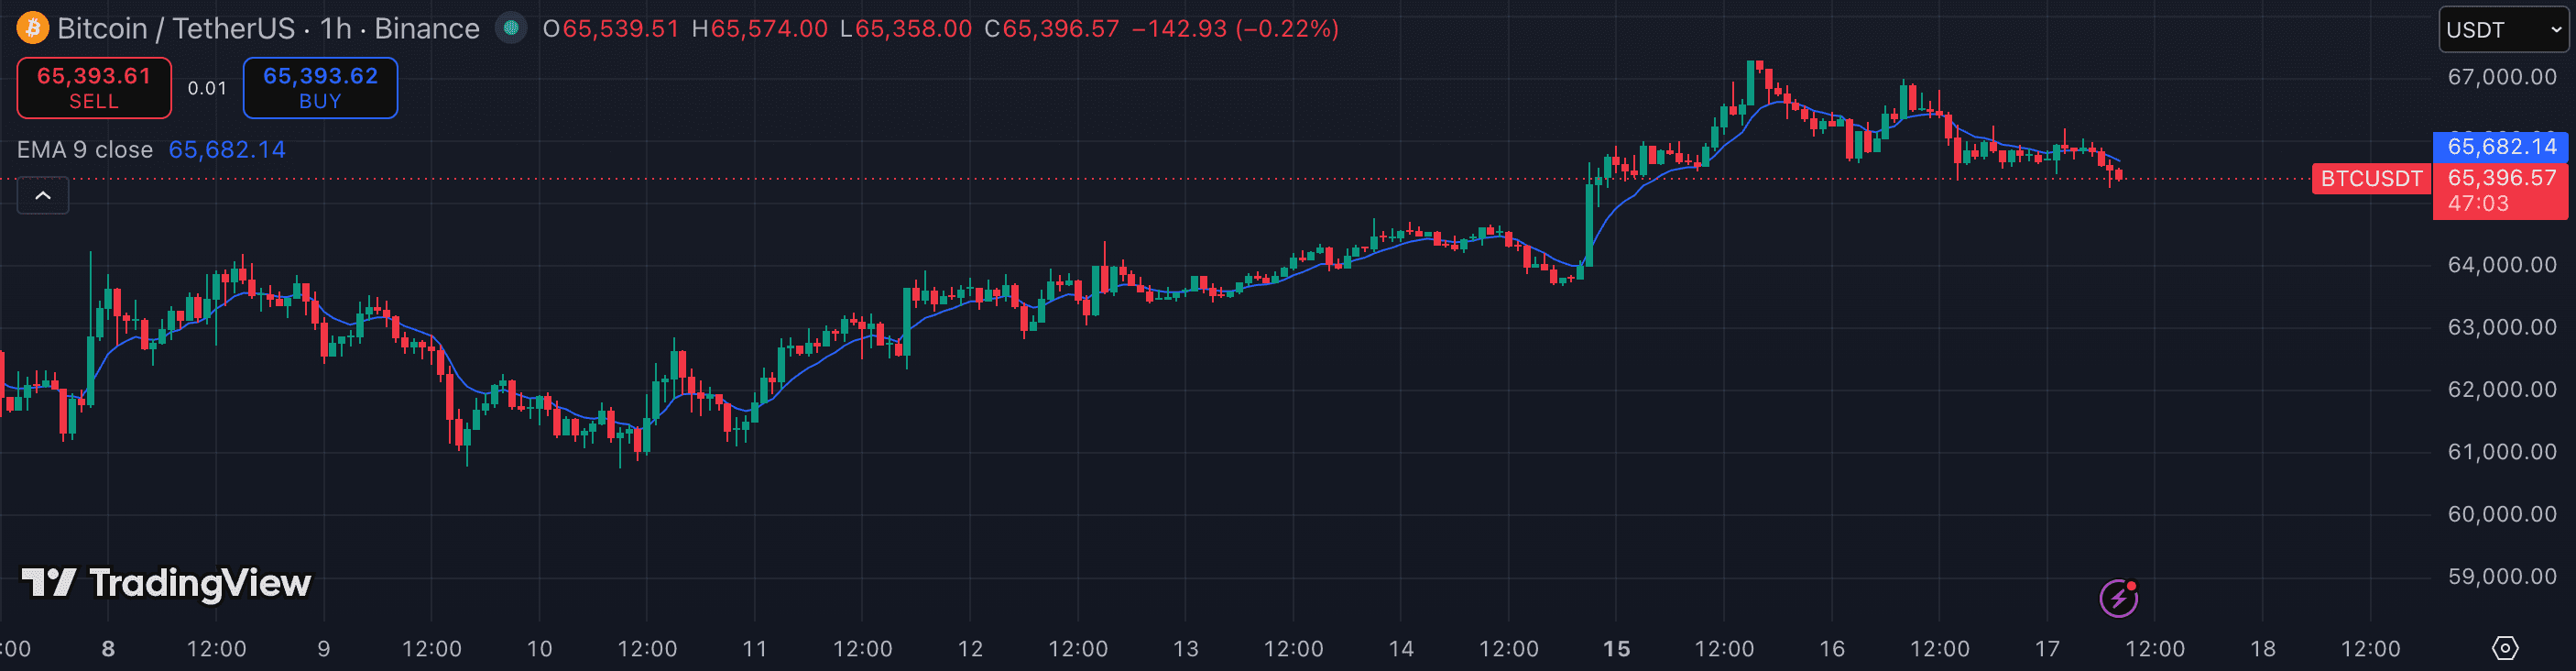
Moving Average (EMA/SMA)
trendBuilt-inThe 21 EMA on the 4h chart is the standard pullback re-entry zone in crypto bull runs. Price trading above the 21 EMA is the simplest mechanical confirmation that the uptrend continues; a dip to the 21 EMA in a strong trend is a re-entry opportunity rather than an exit signal.
Best for: Anyone who needs a simple, reliable trend bias·TFs:15m1h4hRead review4.2/5 - 03RANK
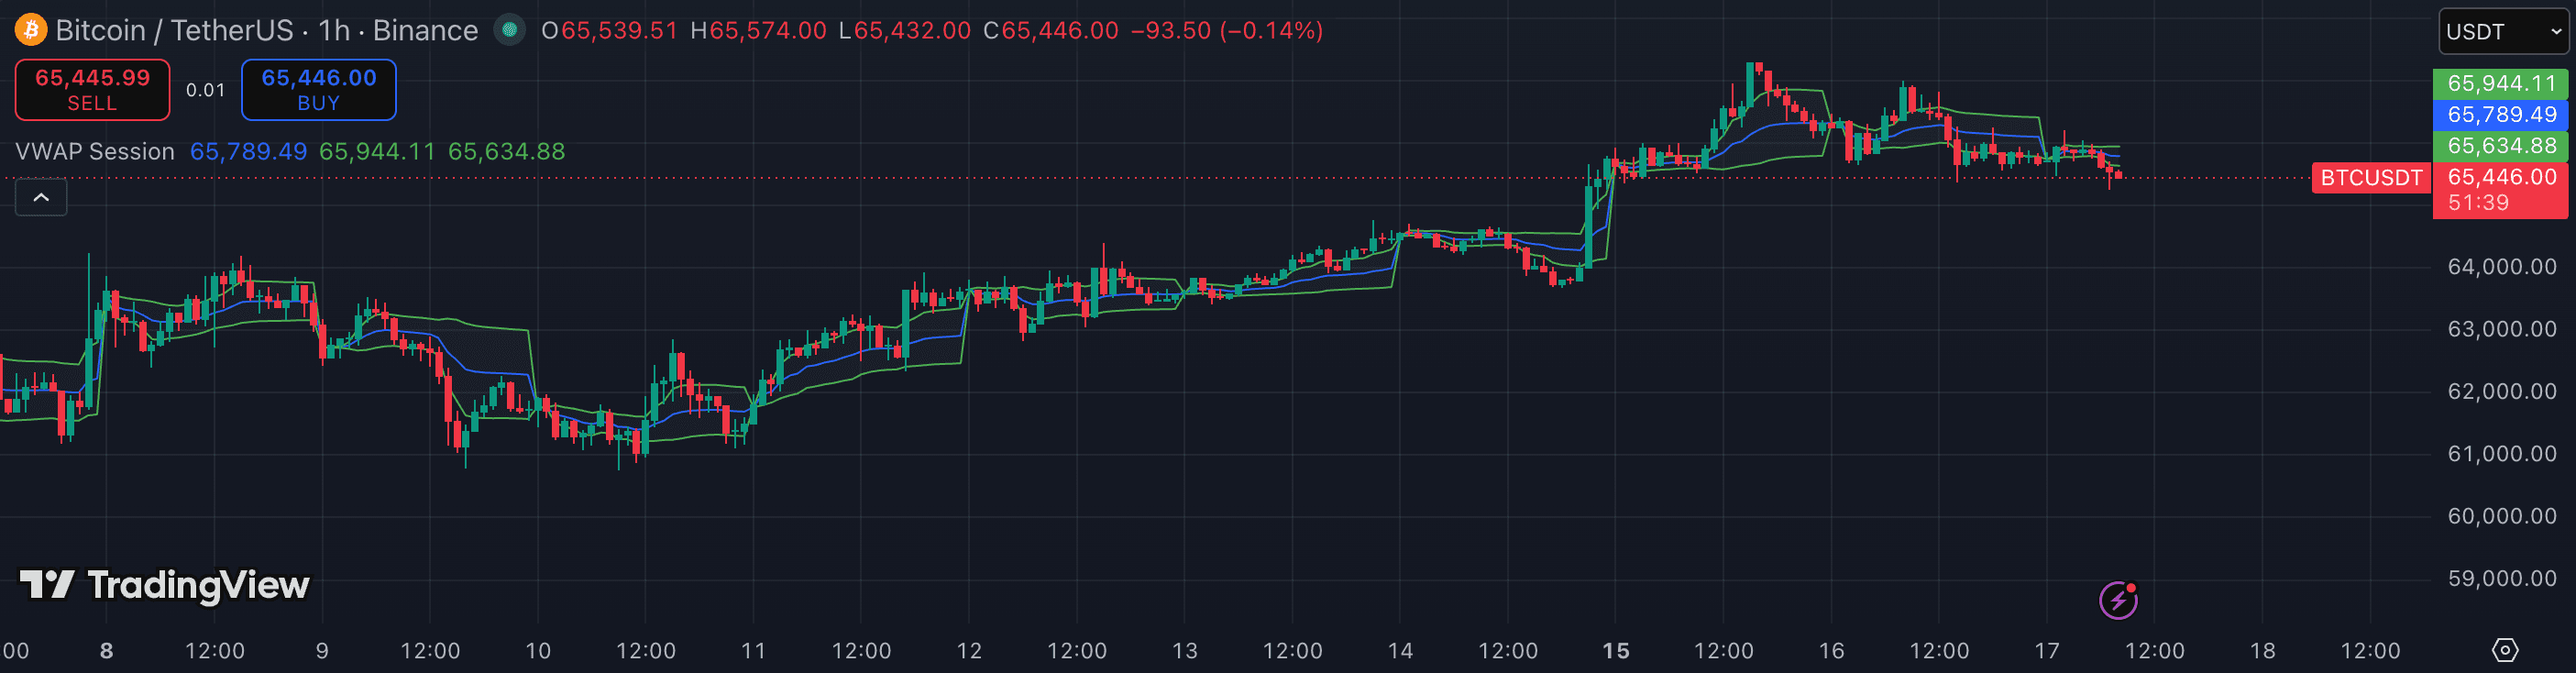
VWAP
volumeBuilt-inAnchored VWAP from a major breakout point shows whether buyers who entered at the key level are still in profit — as long as price holds above the anchored VWAP, the breakout's sponsoring participants are still long and the move has institutional backing.
Best for: Intraday traders needing a fair-value anchor·TFs:1m5m15mRead review4.6/5 - 04RANK
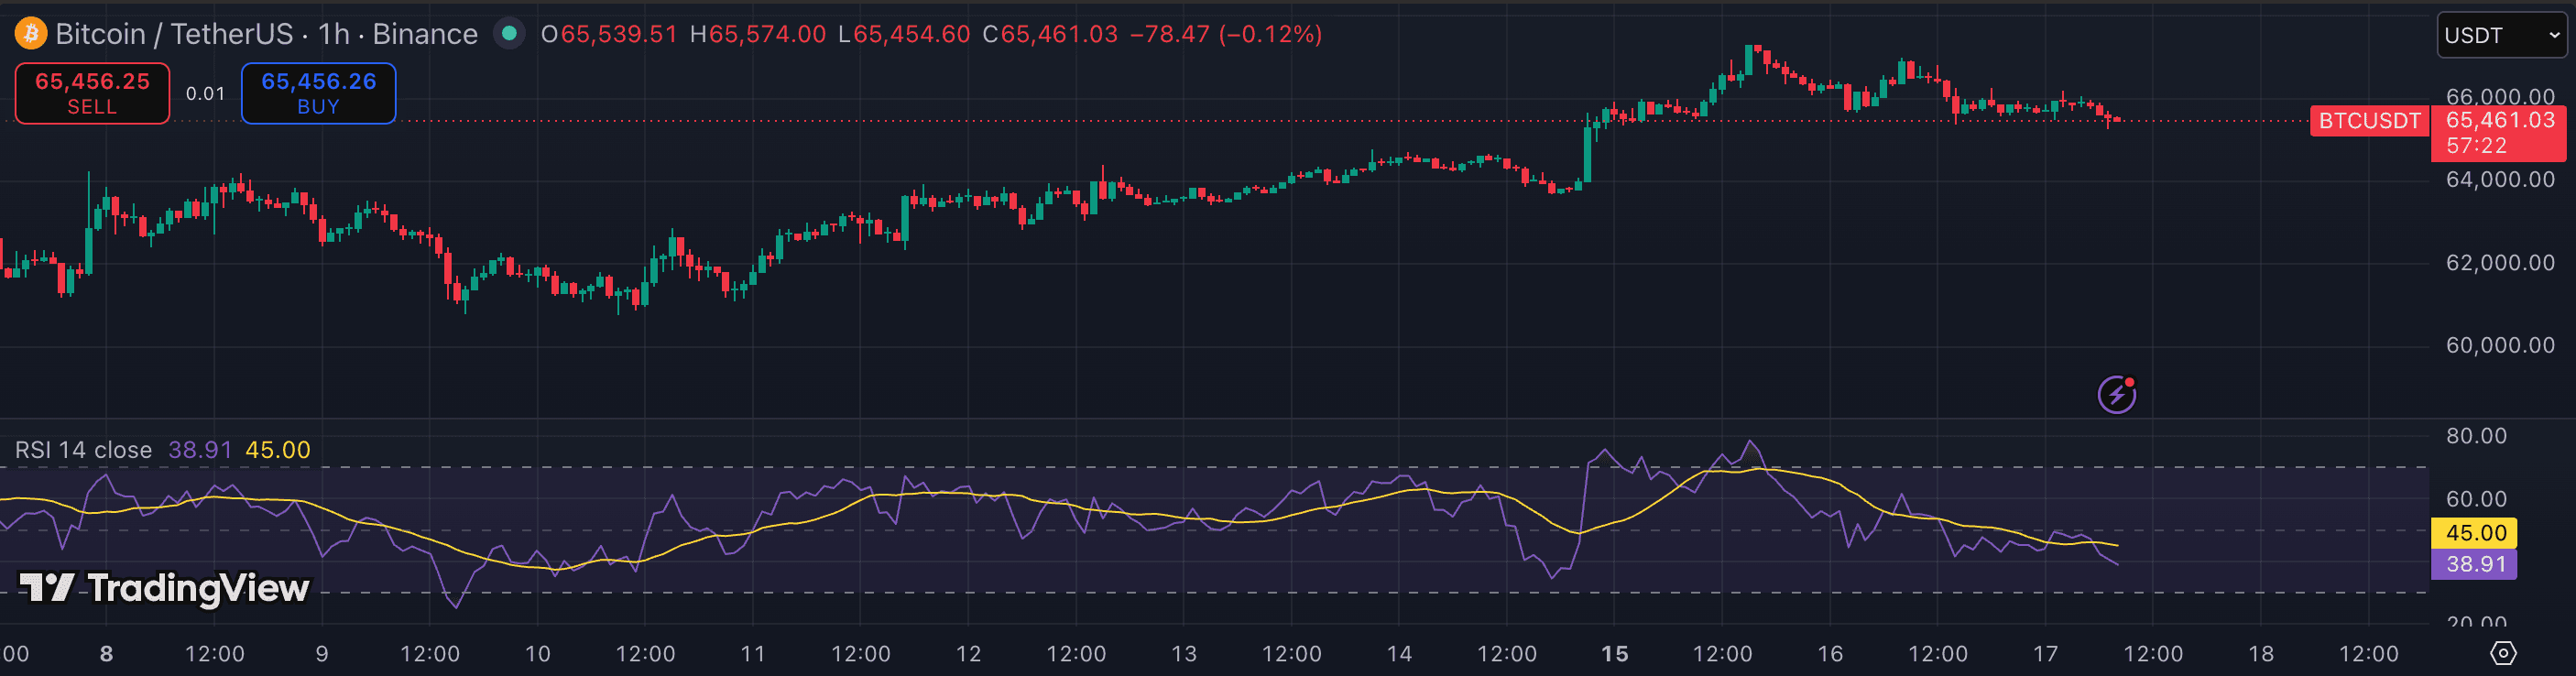
RSI (Relative Strength Index)
momentumBuilt-inRSI in a bull market lives in the 40–80 range rather than the standard 30–70 zone. Pullbacks to 40–50 RSI are the buyable dips; a failure to reclaim 50 after a decline is the first structural warning that the trend may be weakening. Divergence at the high is the clearest early-exit signal.
Best for: Swing entries on BTC/ETH 1h+·TFs:1h4hRead review4.3/5 - 05RANK
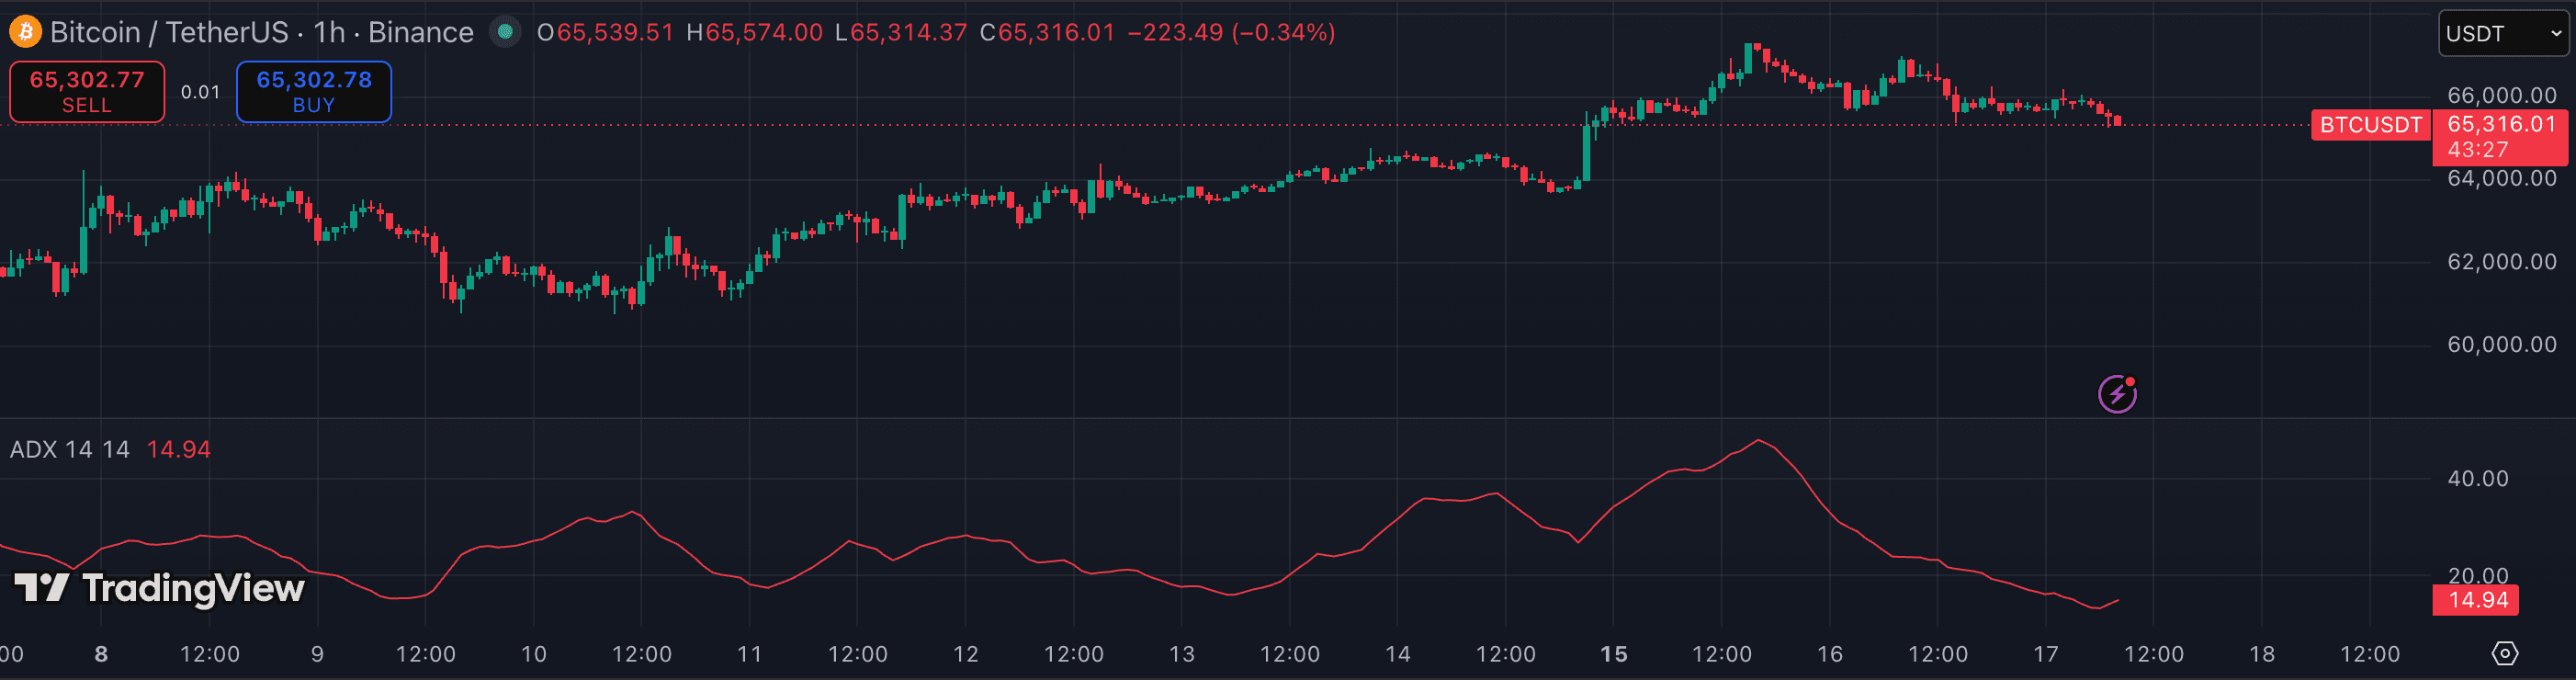
ADX (Average Directional Index)
trendBuilt-inADX above 25 and rising confirms the bull trend has genuine momentum behind it rather than being a slow drift higher that could reverse quickly. When ADX starts declining from a high reading, the trend is losing energy — a signal to reduce size rather than add aggressively.
Best for: Trend traders who want a chop filter·TFs:1h4h1DRead review4.1/5 - 06RANK
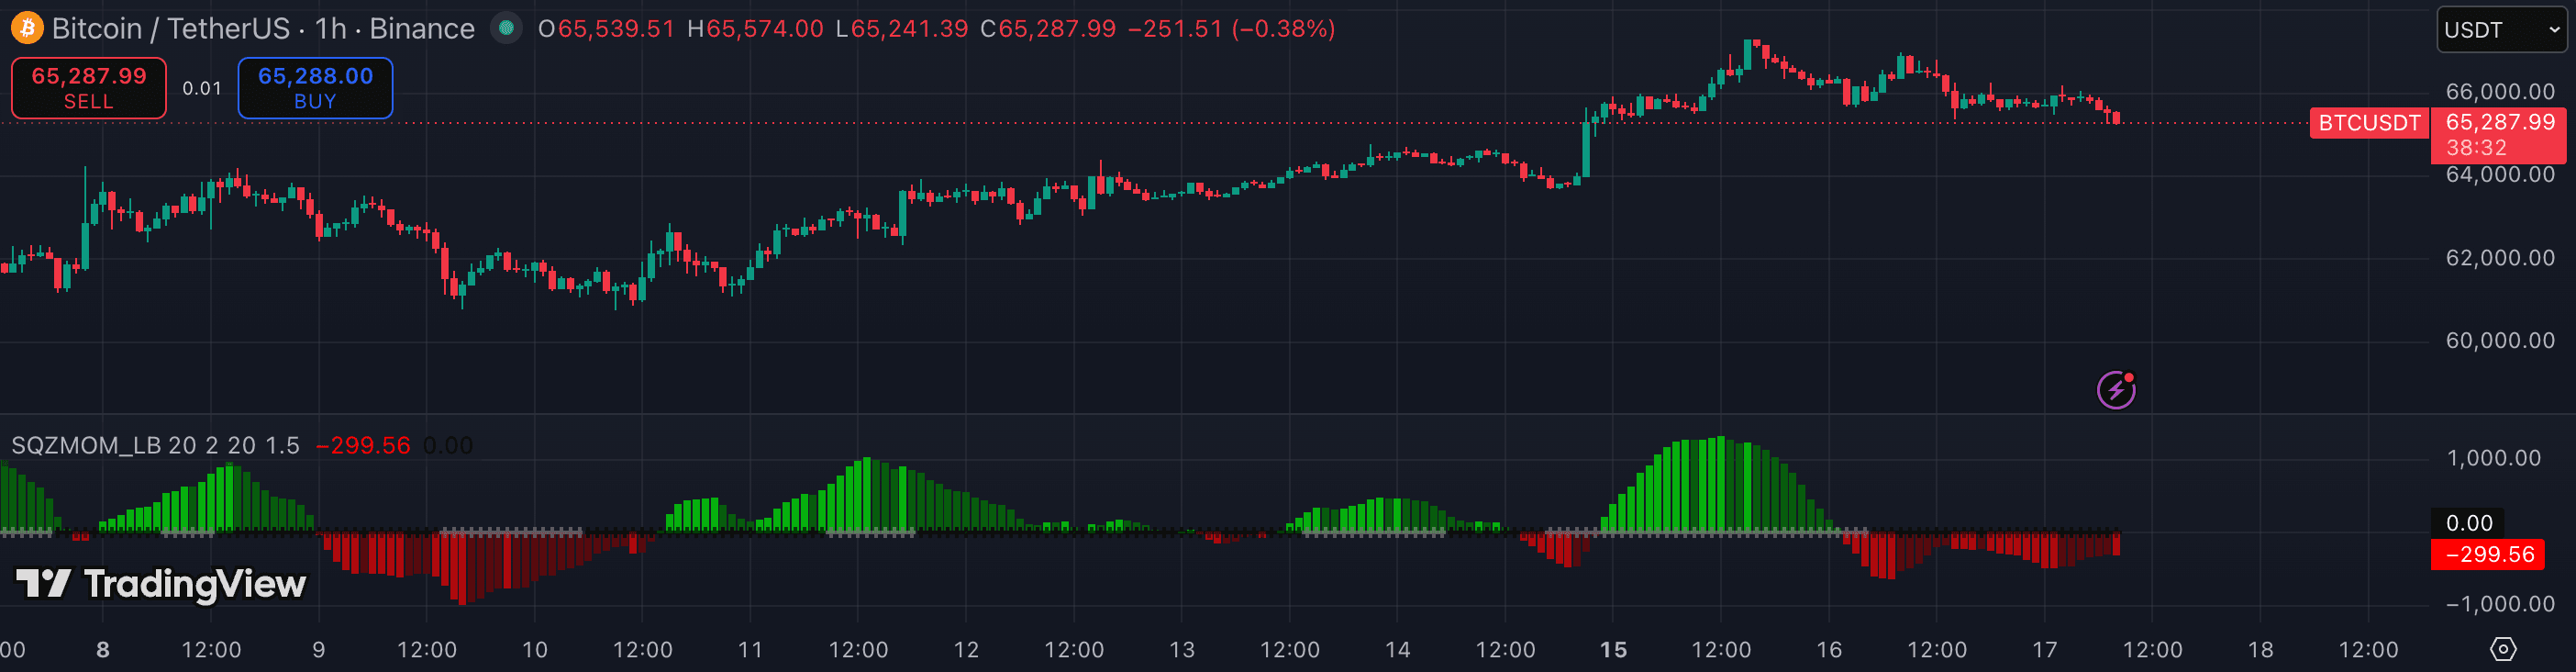
Squeeze Momentum
momentumFreePeriodic consolidations (squeezes) within a bull trend are where the Squeeze Momentum indicator earns its place: when Bollinger Bands contract inside Keltner Channels, a continuation move is coiling. The histogram direction on the squeeze release tells you whether the breakout aligns with the prevailing uptrend.
Best for: Breakout traders waiting for compression·TFs:1h4h1DRead review4.3/5
The whole list, at a glance.
| # | Indicator | Category | Best timeframe | Pricing | Rating |
|---|---|---|---|---|---|
| 01 | Supertrend | trend | 15m1h4h | Free | 4.6/5 |
| 02 | Moving Average (EMA/SMA) | trend | 15m1h4h | Built-in | 4.2/5 |
| 03 | VWAP | volume | 1m5m15m | Built-in | 4.6/5 |
| 04 | RSI (Relative Strength Index) | momentum | 1h4h | Built-in | 4.3/5 |
| 05 | ADX (Average Directional Index) | trend | 1h4h1D | Built-in | 4.1/5 |
| 06 | Squeeze Momentum | momentum | 1h4h1D | Free | 4.3/5 |
Related rankings
Not investment advice. PineRadar is an editorial directory — links may be affiliate. Always test indicators on a demo account.