The best TradingView indicators for weekly chart trading
The weekly chart filters out most of the intraday noise and reveals the macro trend structure that determines whether you're in a bull or bear phase. Fewer candles means fewer signals — each indicator you add needs to earn its spot. These are the picks that provide real edge on the weekly timeframe.
- 01RANK
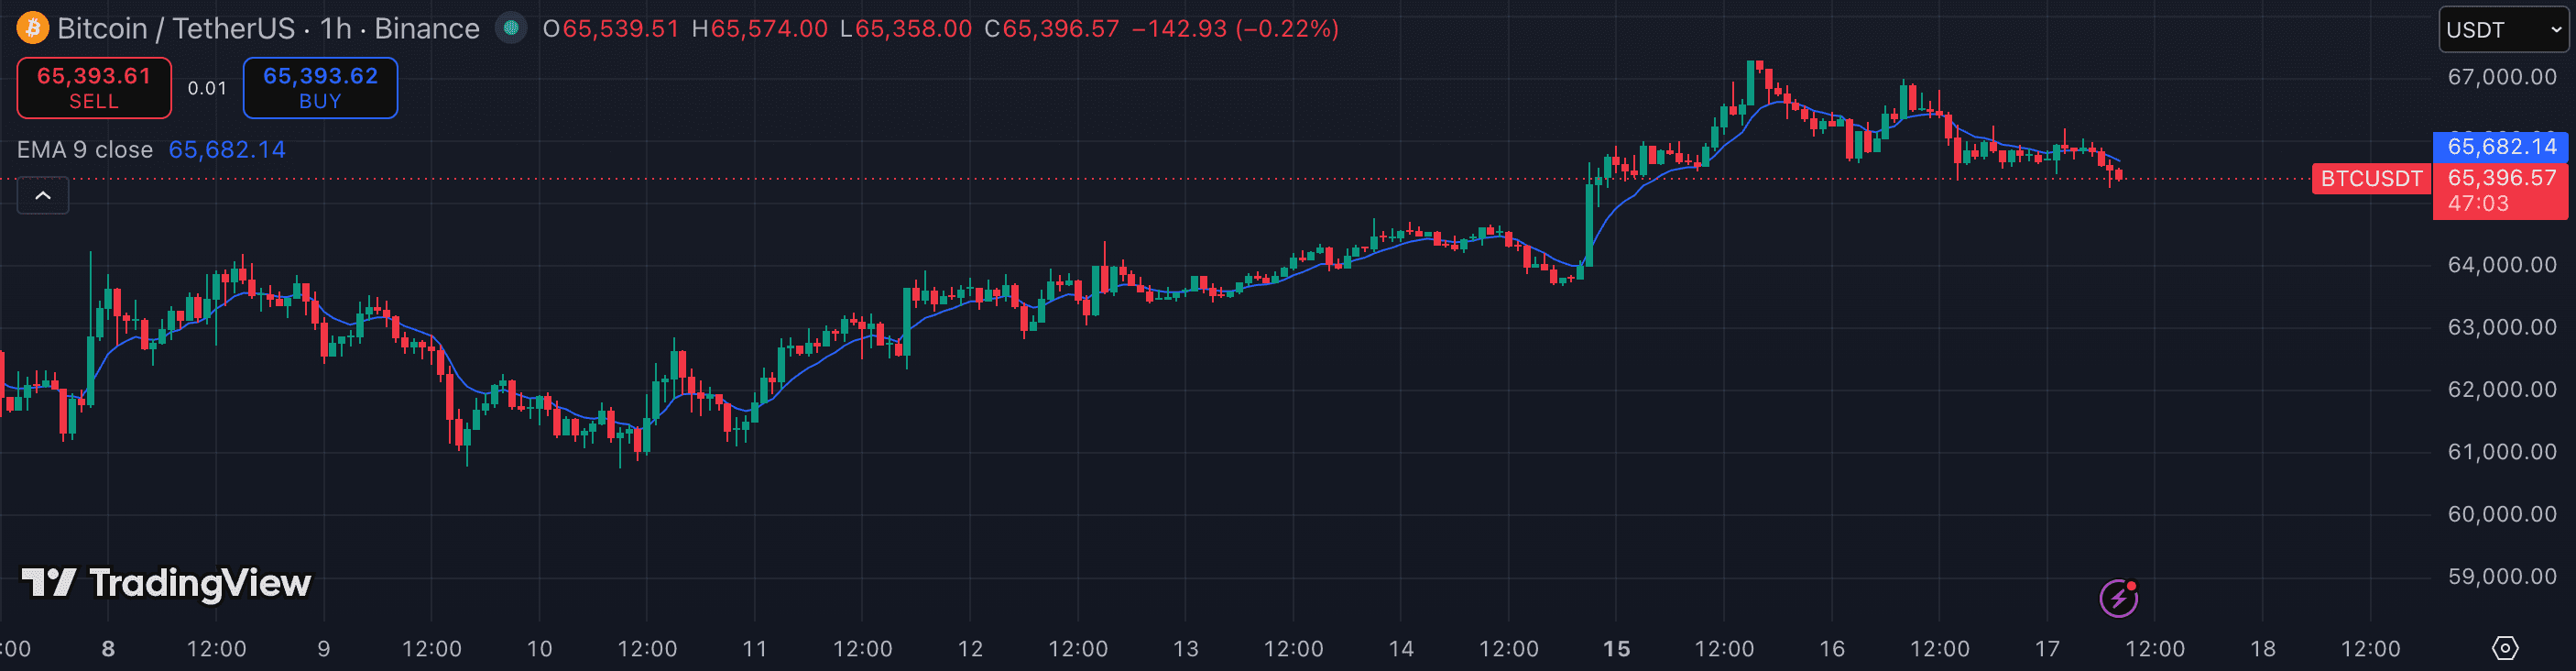
Moving Average (EMA/SMA)
trendBuilt-inThe 20-week and 50-week EMAs are the two most-watched trend levels for institutional participants. Price position relative to these lines sets the macro bias.
Best for: Anyone who needs a simple, reliable trend bias·TFs:15m1h4hRead review4.2/5 - 02RANK
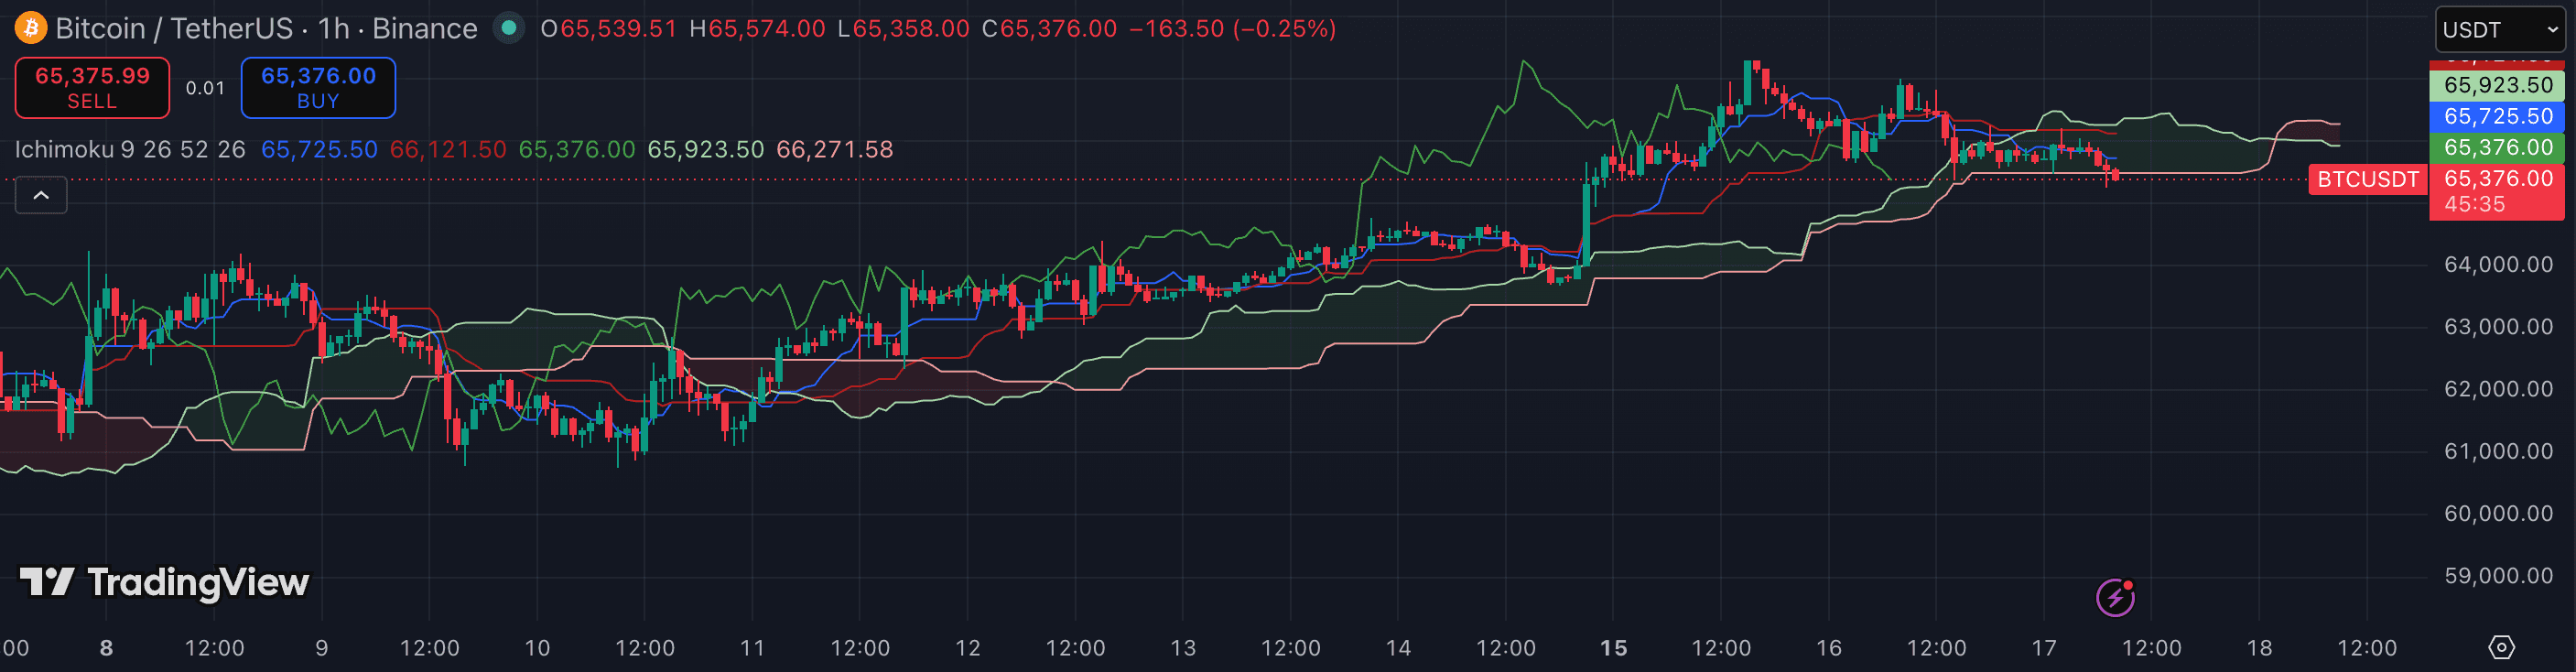
Ichimoku Cloud
trendBuilt-inThe cloud was designed for weekly charts — the standard 9/26/52 settings align with trading weeks and provide forward-looking support and resistance via the cloud span.
Best for: Swing traders wanting one all-in-one overlay·TFs:4h1D1WRead review4.2/5 - 03RANK
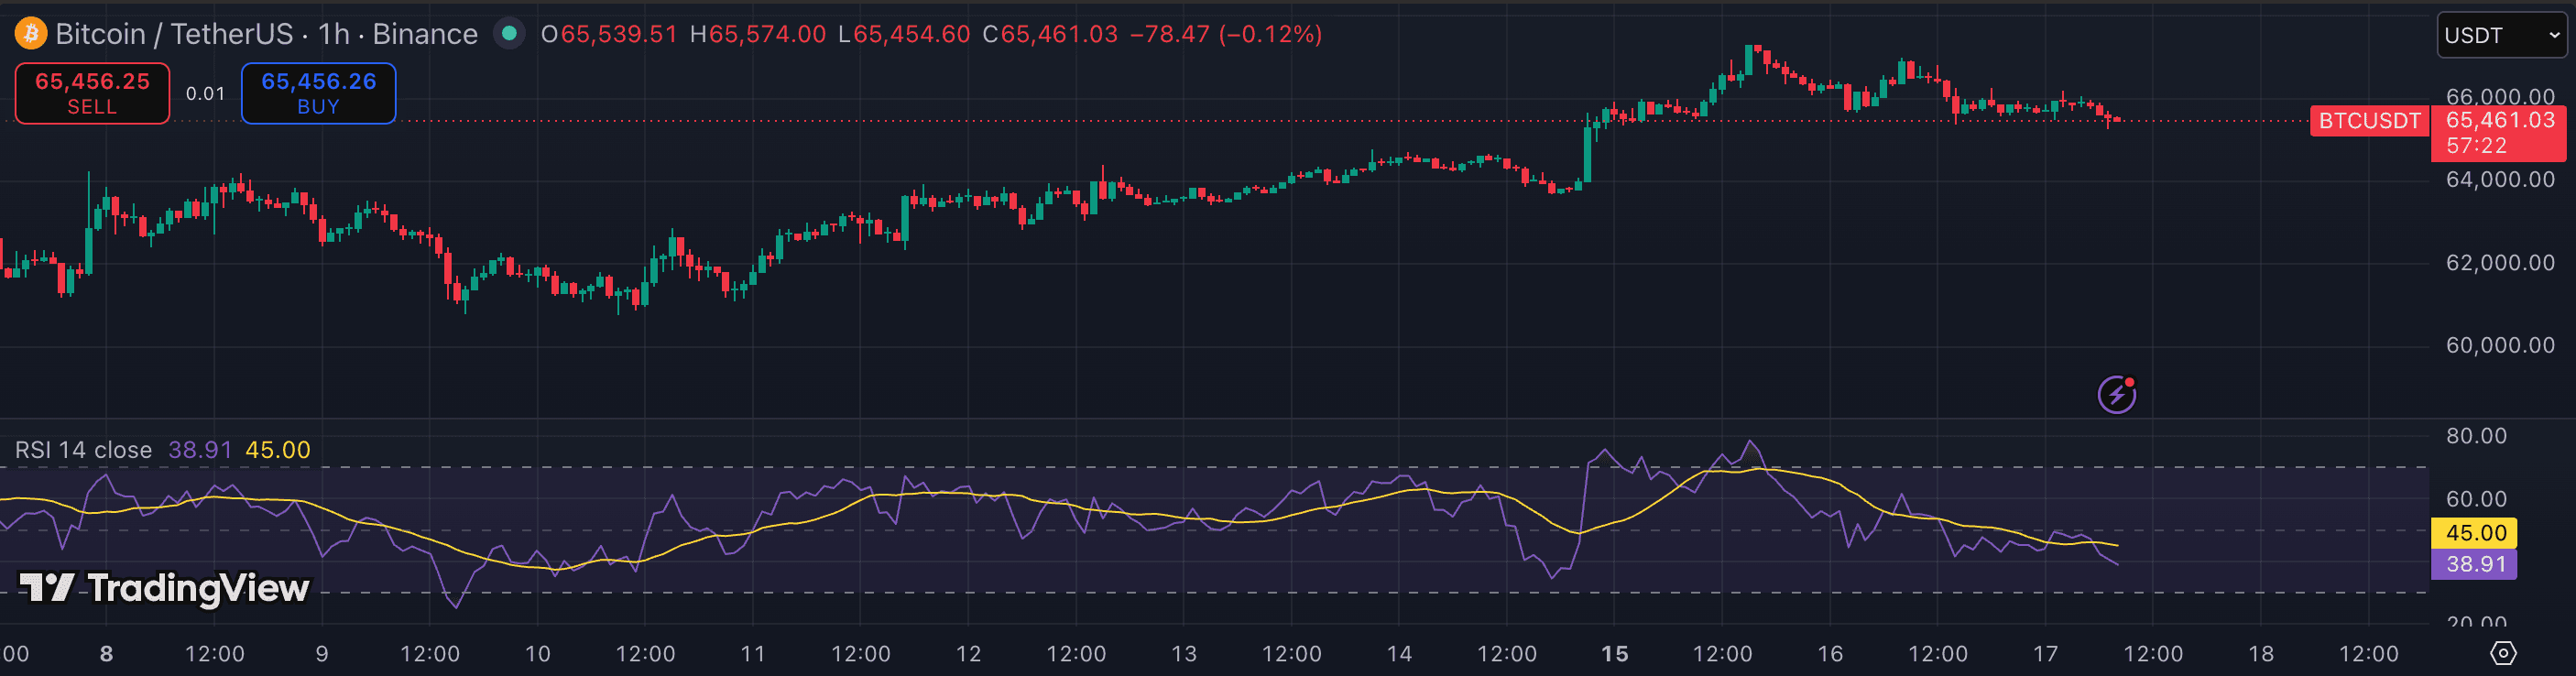
RSI (Relative Strength Index)
momentumBuilt-inWeekly RSI turning from below 30 or holding above 50 for multiple weeks are reliable macro momentum regime signals. Divergence on the weekly is high-quality and slow to repaint.
Best for: Swing entries on BTC/ETH 1h+·TFs:1h4hRead review4.3/5 - 04RANK
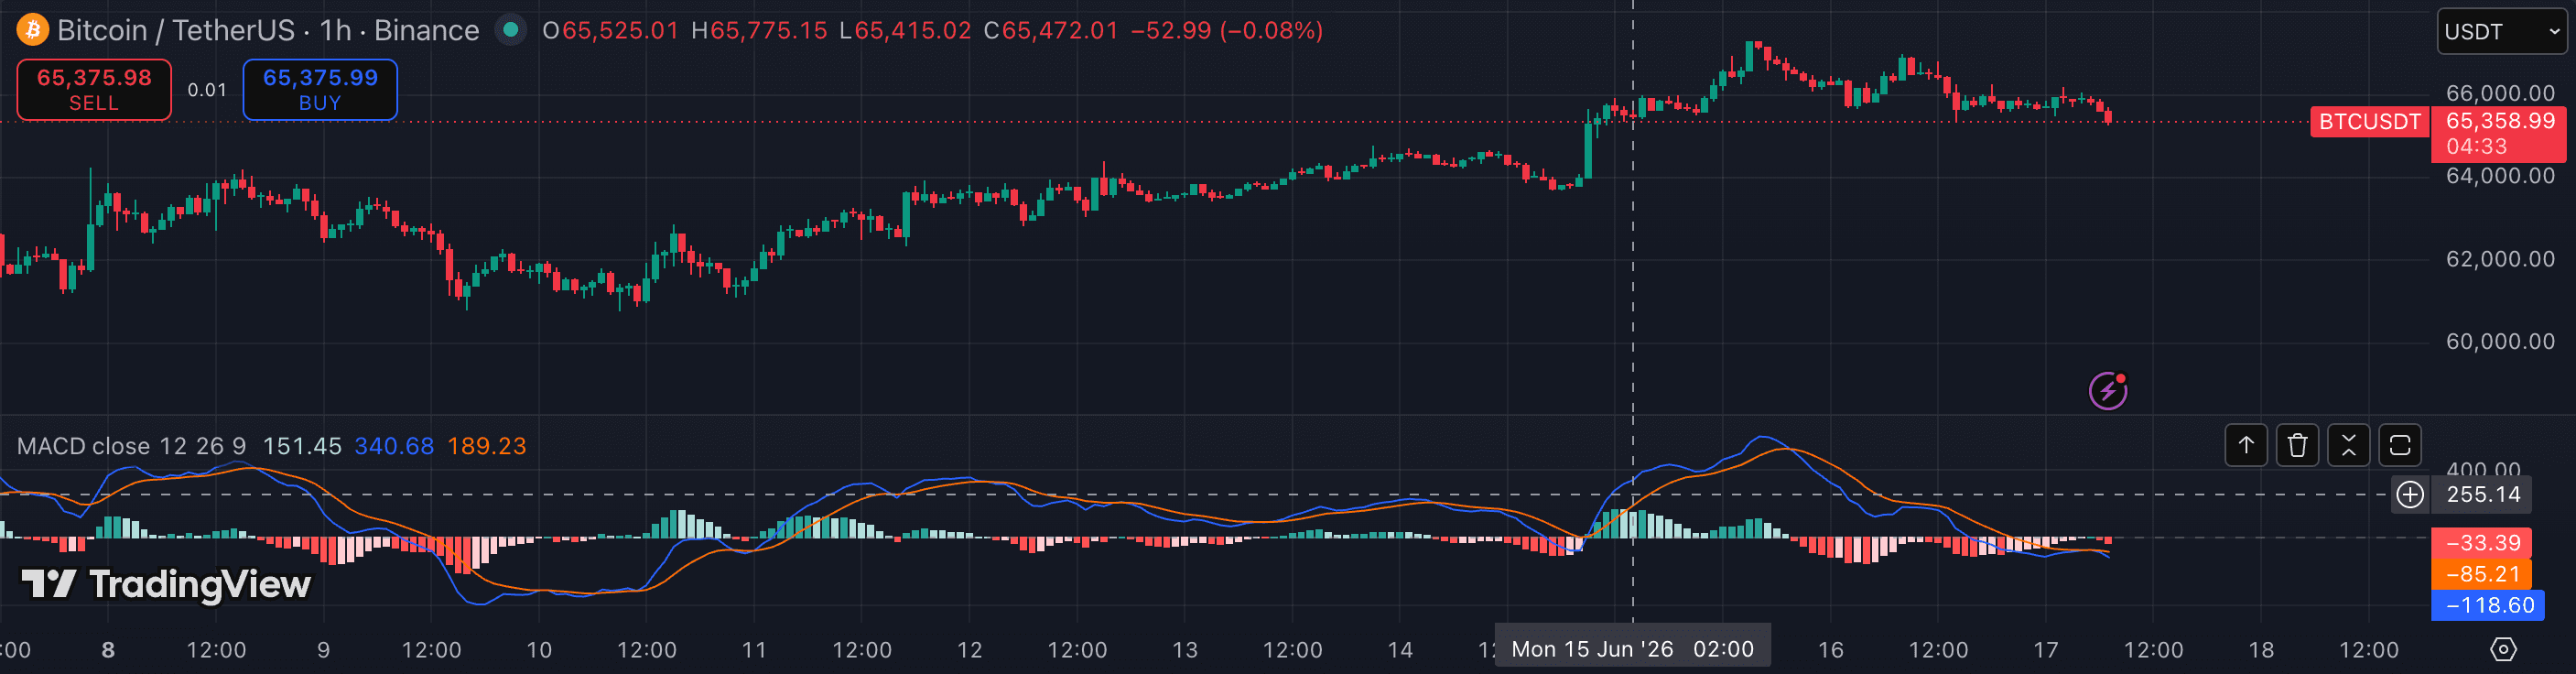
MACD
momentumBuilt-inMACD histogram on the weekly shows multi-week momentum buildup. Zero-line crossovers on this timeframe are low-frequency but historically significant on BTC/ETH.
Best for: Traders who want trend and momentum on one pane·TFs:1h4h1DRead review4.1/5 - 05RANK
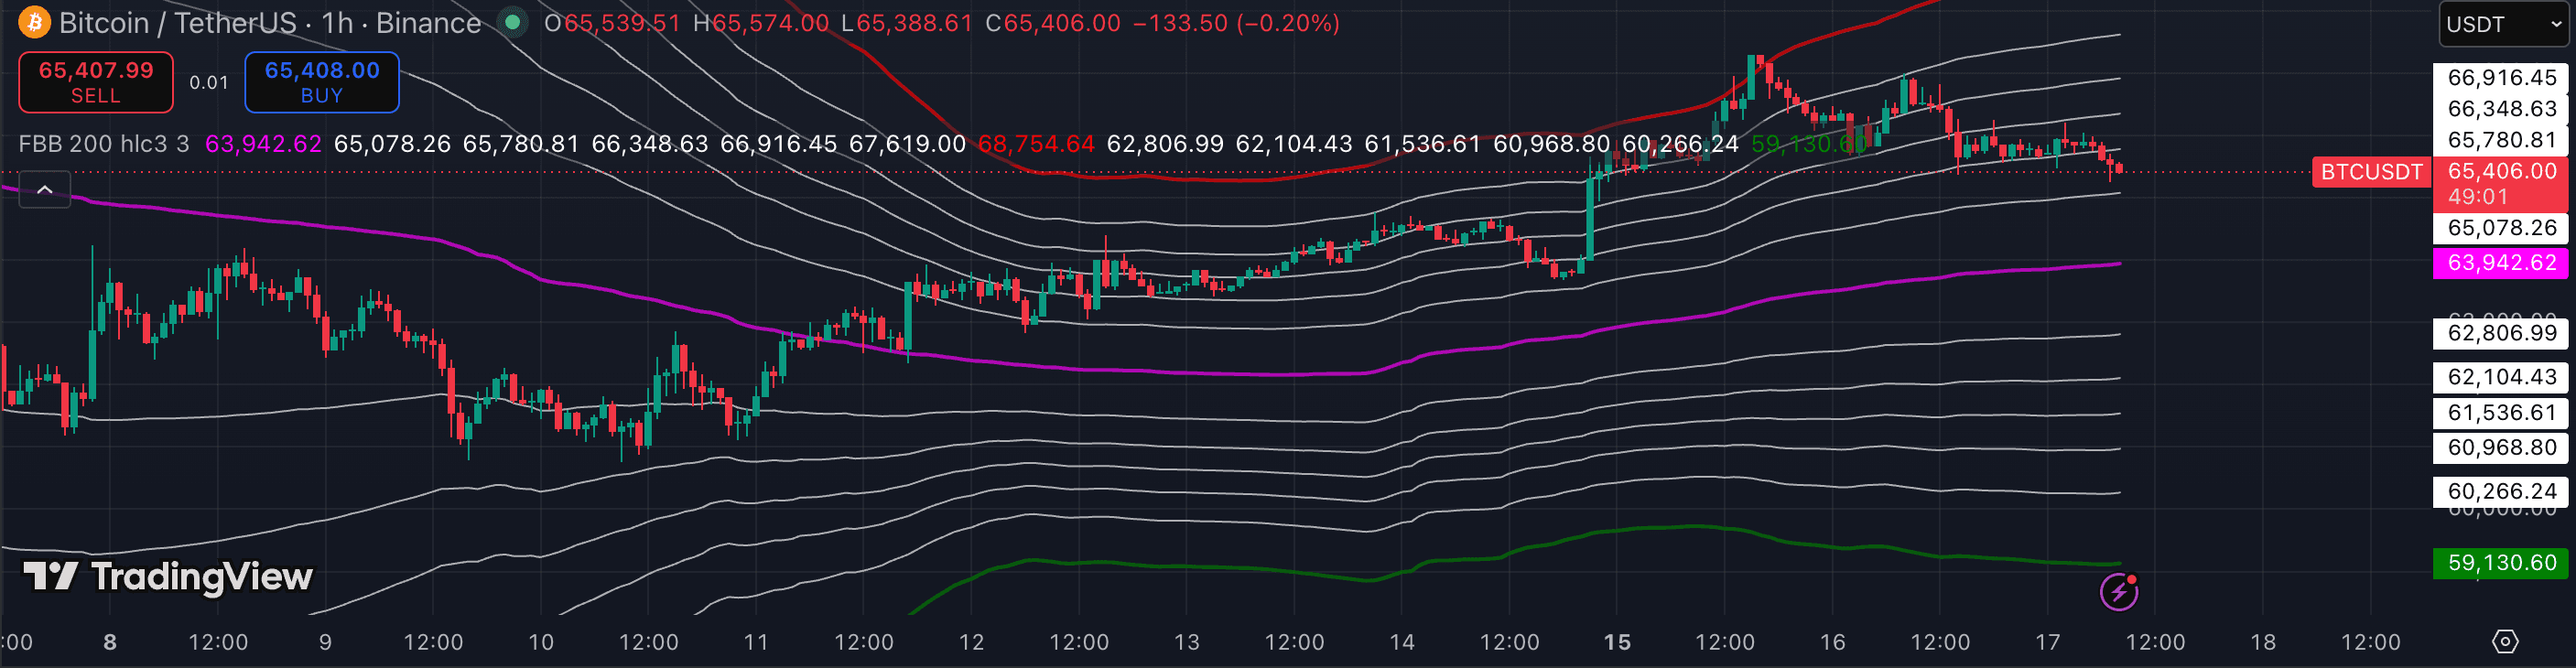
Bollinger Bands
volatilityBuilt-inWeekly Bollinger squeezes precede major breakout moves. When the weekly bands contract tightly, a large directional move is typically developing.
Best for: Range traders reading volatility·TFs:15m1h4hRead review4.2/5 - 06RANK
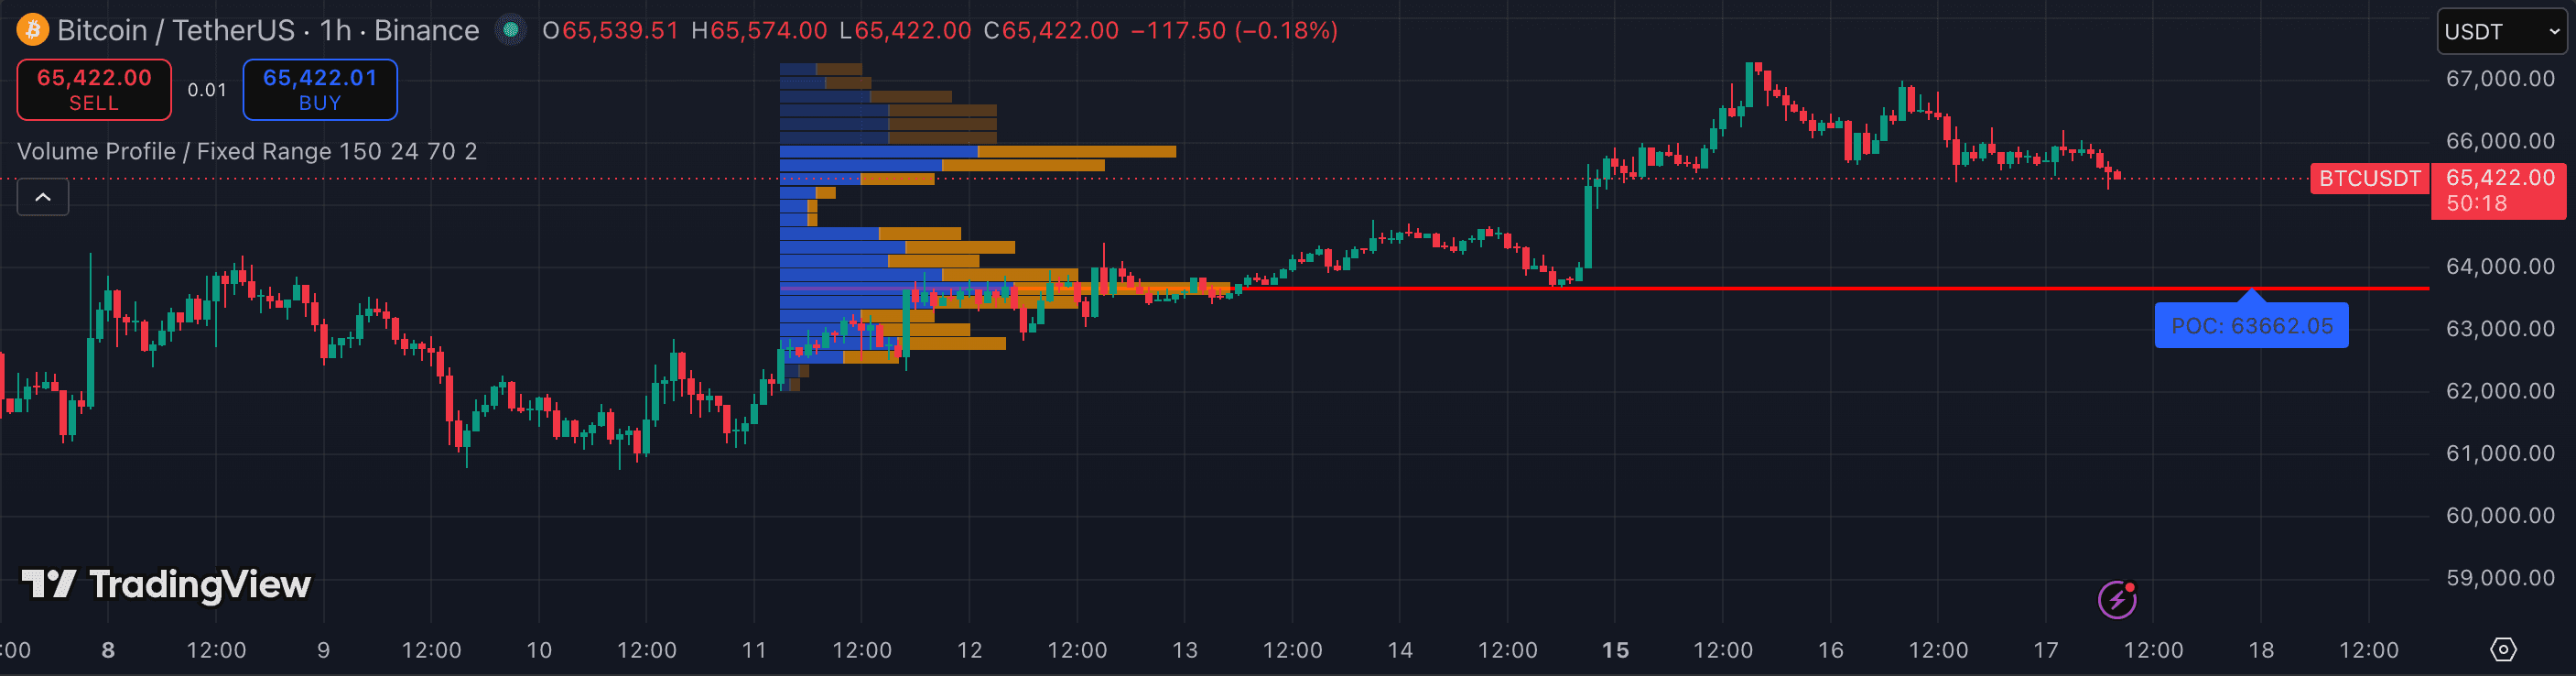
Volume Profile (Fixed Range)
volumeBuilt-inA multi-month fixed-range Volume Profile anchored to a prior consolidation reveals the macro value area and POC — the key acceptance levels for long-term traders.
Best for: Anyone trading levels, not candles·TFs:1h4h1DRead review4.7/5
The whole list, at a glance.
| # | Indicator | Category | Best timeframe | Pricing | Rating |
|---|---|---|---|---|---|
| 01 | Moving Average (EMA/SMA) | trend | 15m1h4h | Built-in | 4.2/5 |
| 02 | Ichimoku Cloud | trend | 4h1D1W | Built-in | 4.2/5 |
| 03 | RSI (Relative Strength Index) | momentum | 1h4h | Built-in | 4.3/5 |
| 04 | MACD | momentum | 1h4h1D | Built-in | 4.1/5 |
| 05 | Bollinger Bands | volatility | 15m1h4h | Built-in | 4.2/5 |
| 06 | Volume Profile (Fixed Range) | volume | 1h4h1D | Built-in | 4.7/5 |
Related rankings
Not investment advice. PineRadar is an editorial directory — links may be affiliate. Always test indicators on a demo account.