The best TradingView indicators for crypto divergence trading
Divergence — when price makes a new high or low but the oscillator doesn't confirm — is one of the most reliable reversal signals in crypto. But not all divergences are equal, and not all indicators catch them equally well. These are the tools that produce the clearest, most actionable divergence signals on crypto charts.
- 01RANK
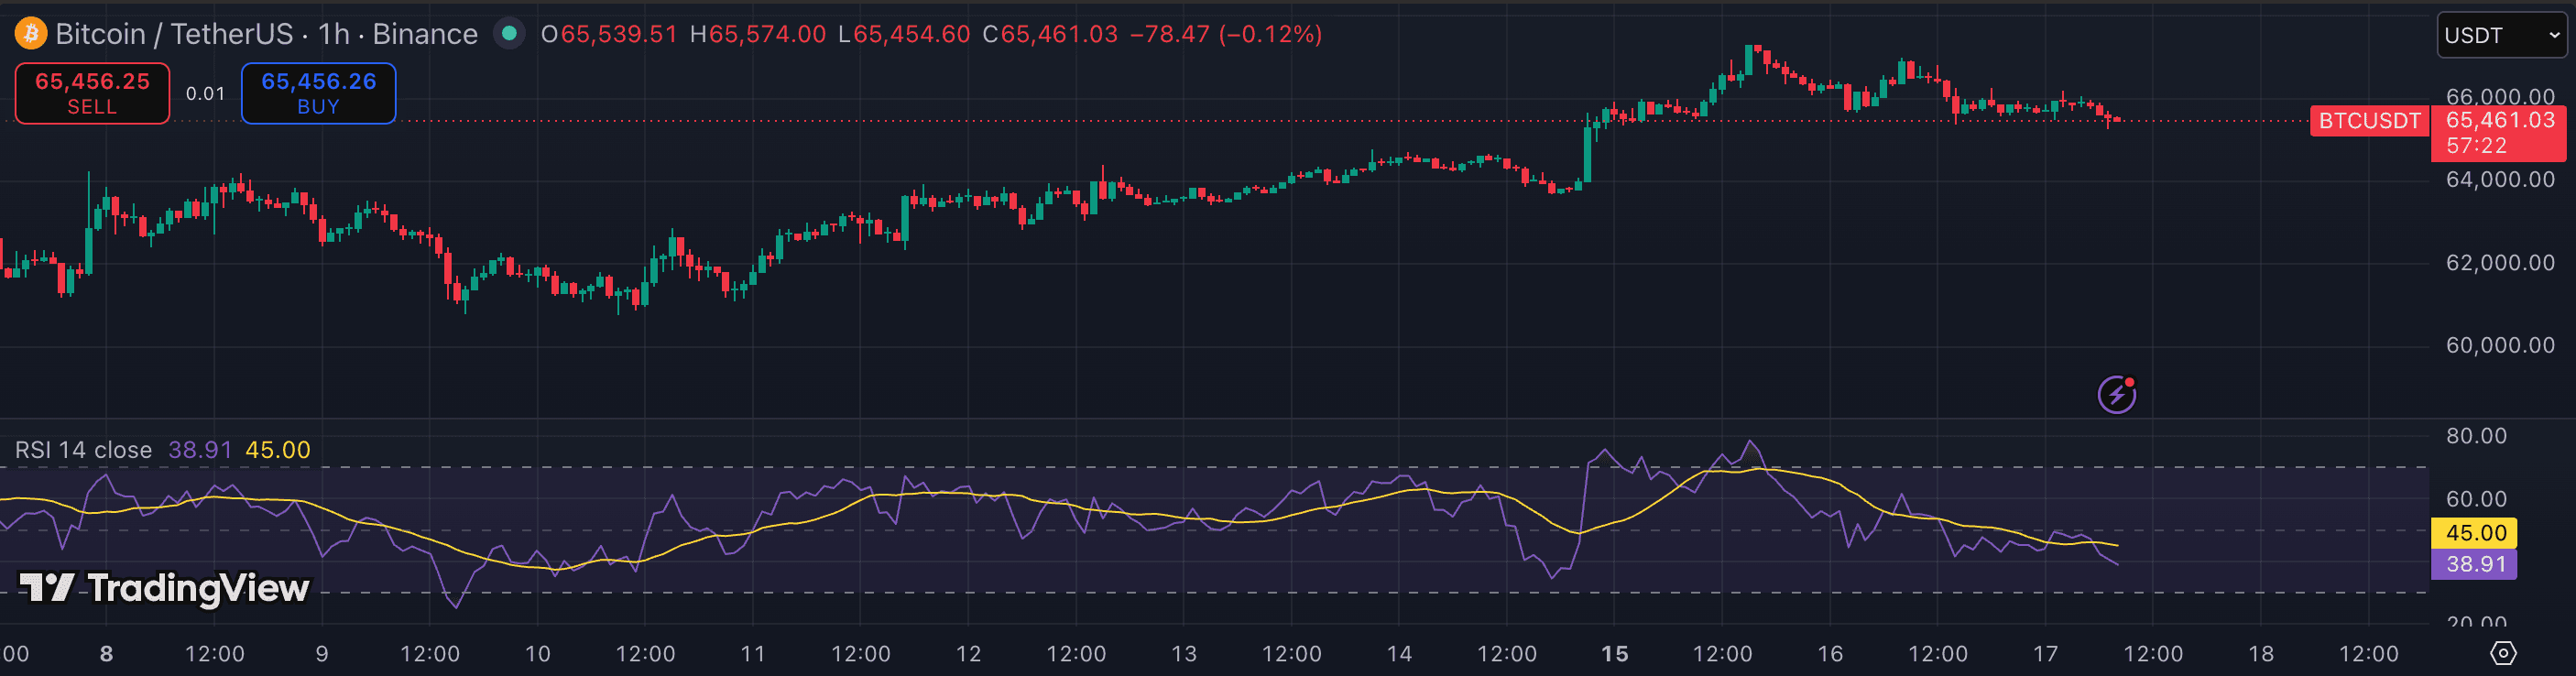
RSI (Relative Strength Index)
momentumBuilt-inRSI divergence on the 1h and 4h is the highest-signal divergence setup available to retail traders. Regular bearish divergence (price new high, RSI lower high) on BTC and ETH has a strong track record of preceding significant corrections. Keep the default length 14 — shorter settings generate too many false divergences.
Best for: Swing entries on BTC/ETH 1h+·TFs:1h4hRead review4.3/5 - 02RANK
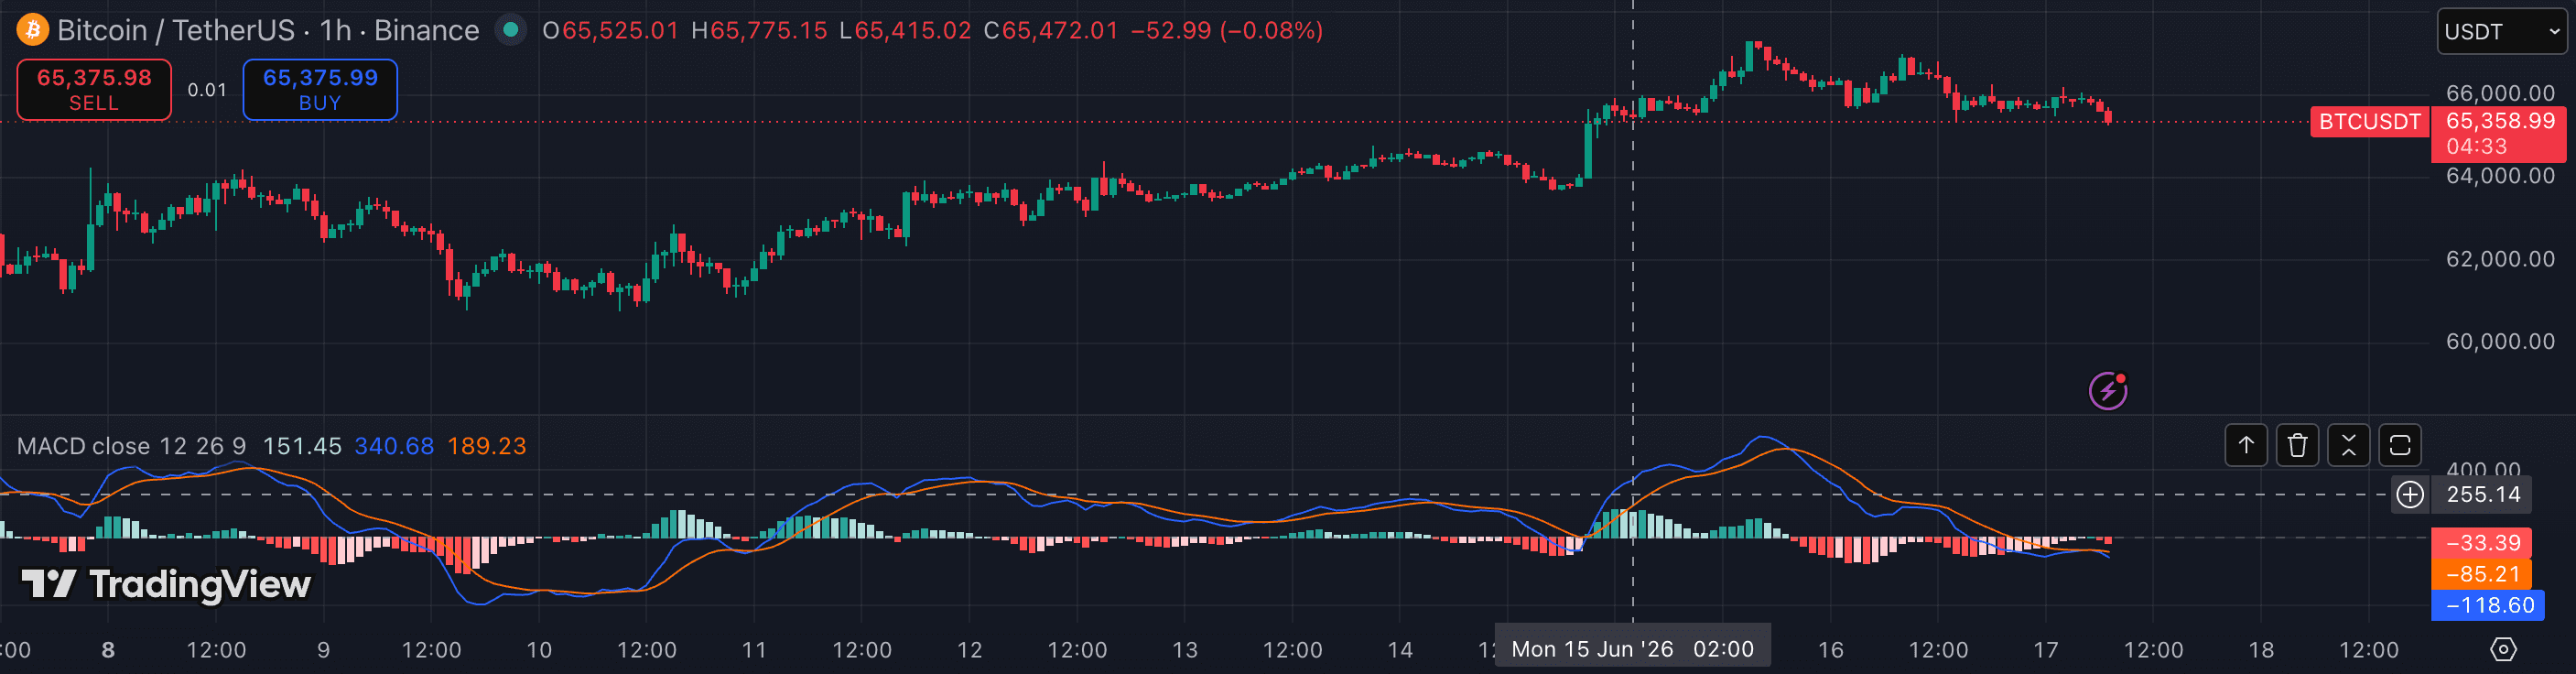
MACD
momentumBuilt-inMACD histogram divergence shows momentum deceleration before the moving average lines cross. Histogram bearish divergence — price makes a new high, histogram peak is lower than the prior peak — is a powerful early warning. Works best on 4h and 1D where noise is filtered.
Best for: Traders who want trend and momentum on one pane·TFs:1h4h1DRead review4.1/5 - 03RANK
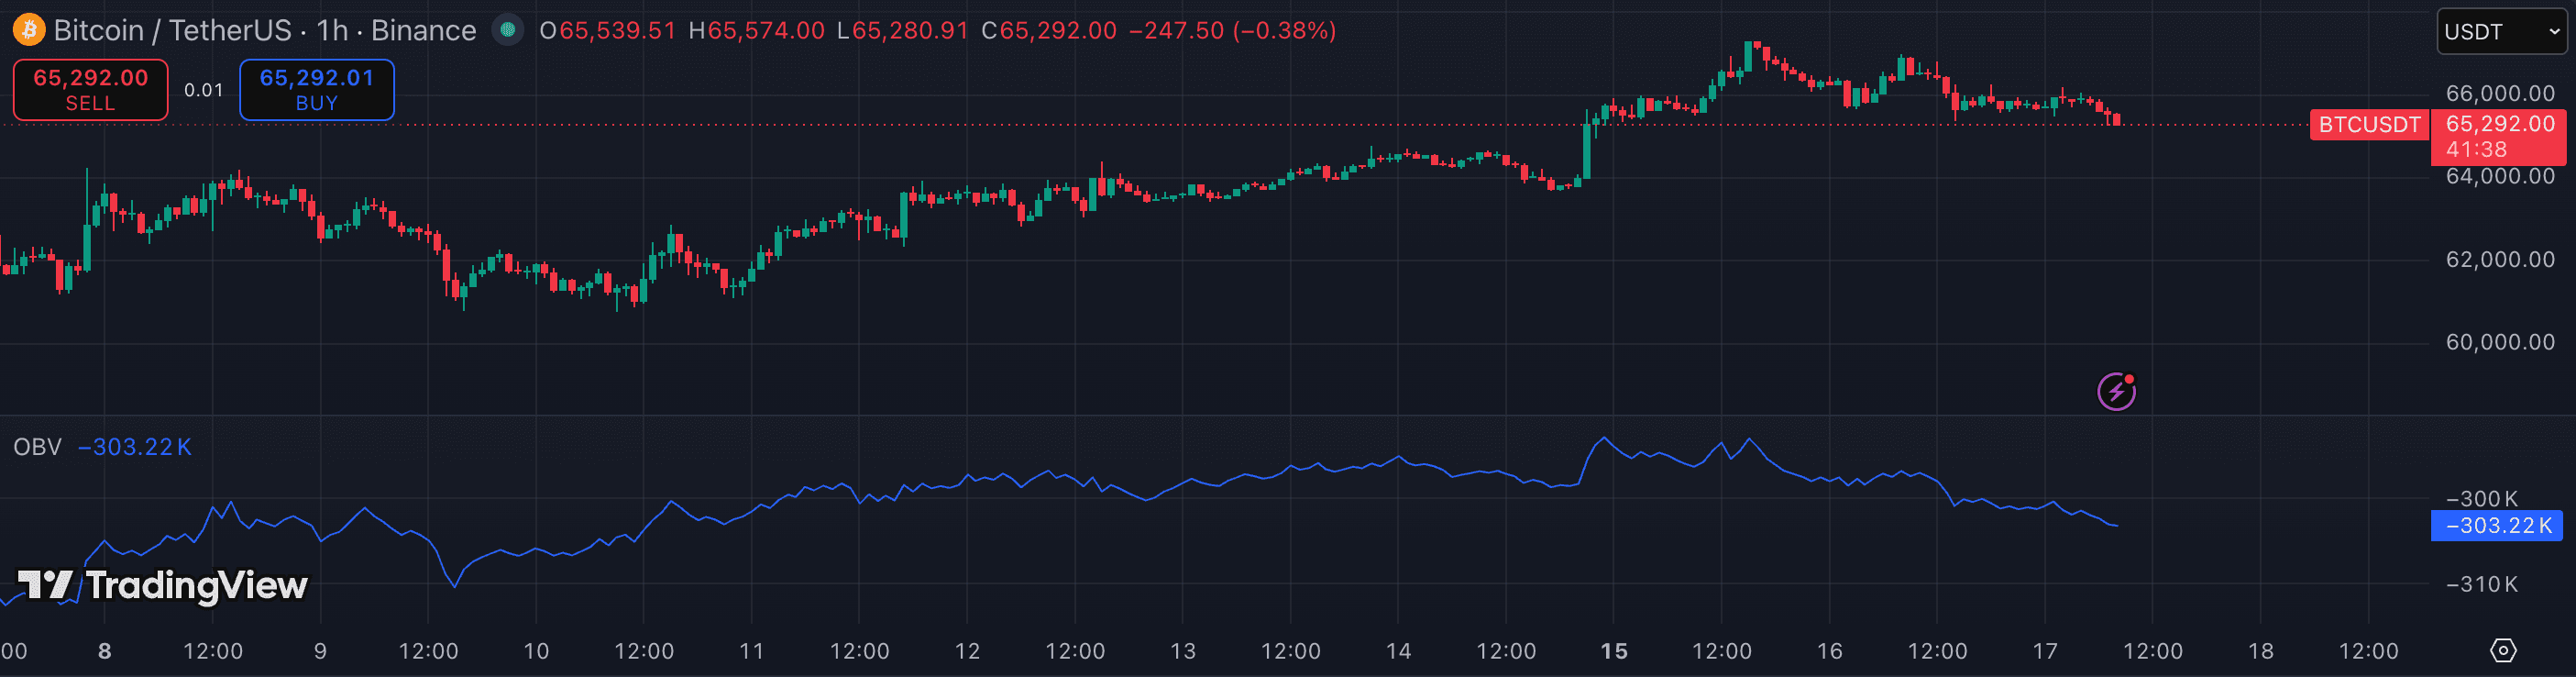
OBV (On-Balance Volume)
volumeBuilt-inOBV divergence is volume-confirmed: when price makes a new high but OBV does not, real buying volume is not participating in the move. This is a distribution signal that often precedes sharp reversals in crypto, particularly on high-cap assets with reliable volume data.
Best for: Traders confirming breakouts with volume·TFs:1h4h1DRead review4.0/5 - 04RANK
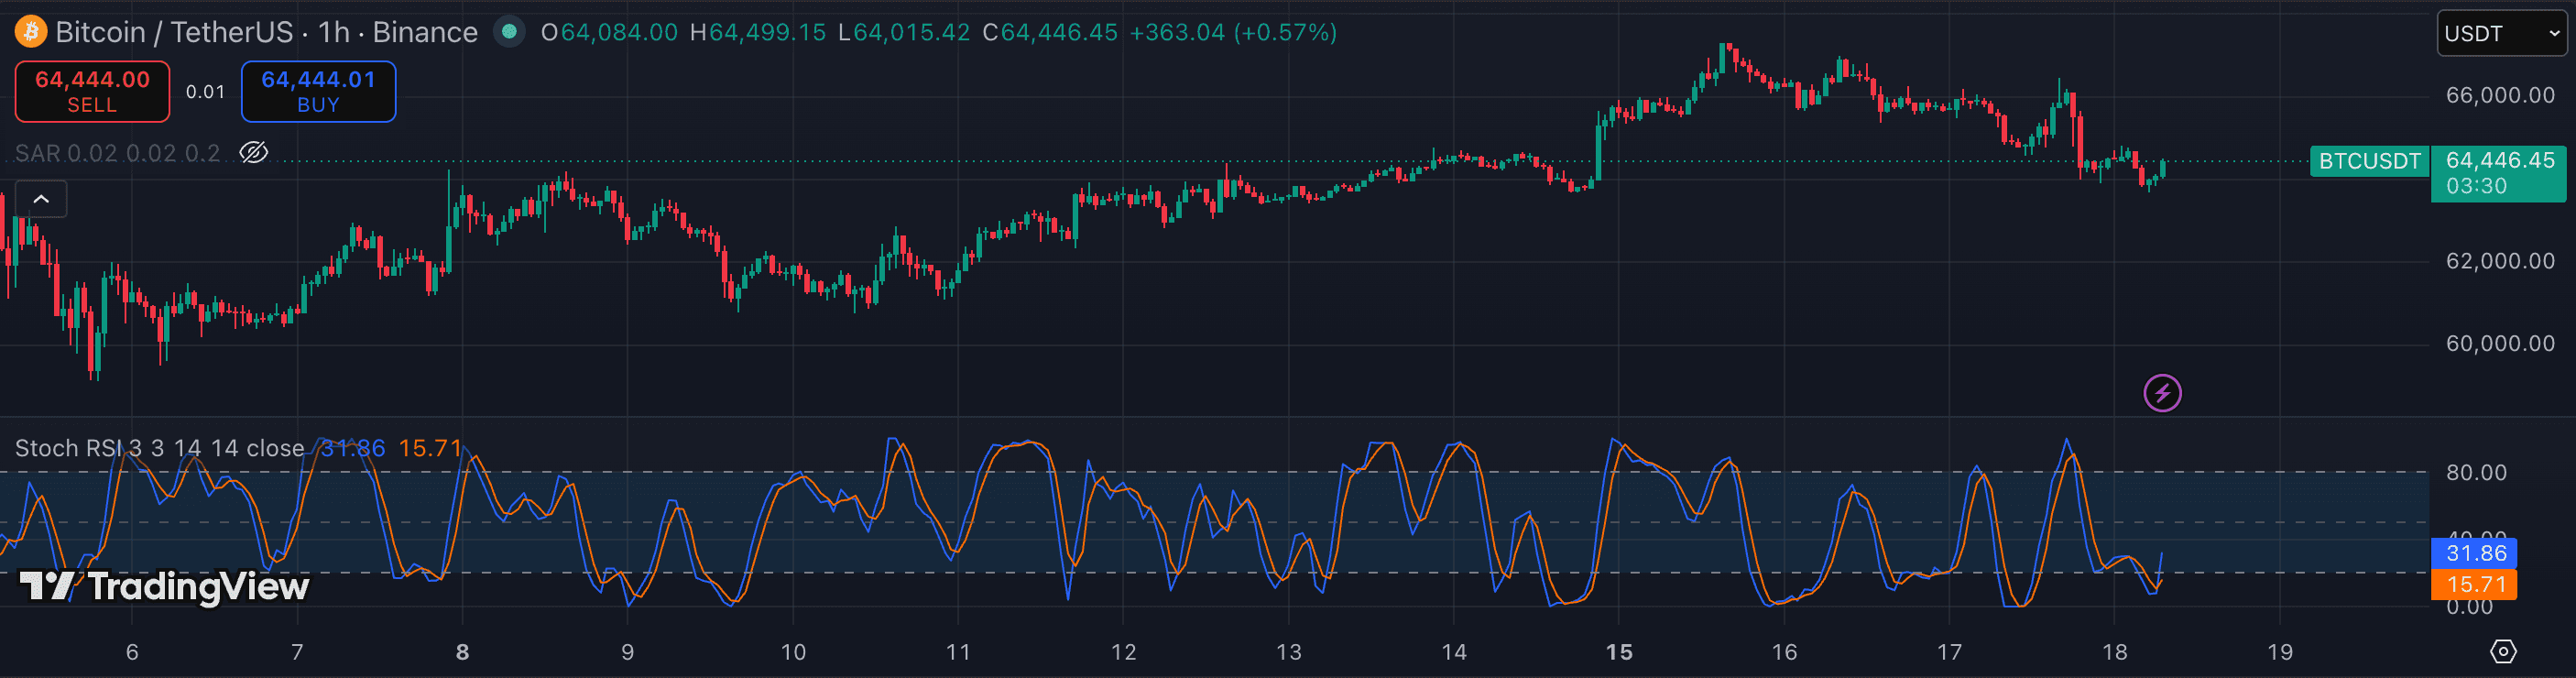
Stochastic RSI
momentumBuilt-inStochastic RSI fires divergence signals earlier than RSI because it is more sensitive to short-term momentum shifts. Use it for lower-timeframe divergence setups (15m–1h) where speed matters more than signal quality. Always look for confirmation from a higher-timeframe RSI or MACD divergence.
Best for: Momentum traders timing precise pullback entries·TFs:15m1h4hRead review4.1/5 - 05RANK
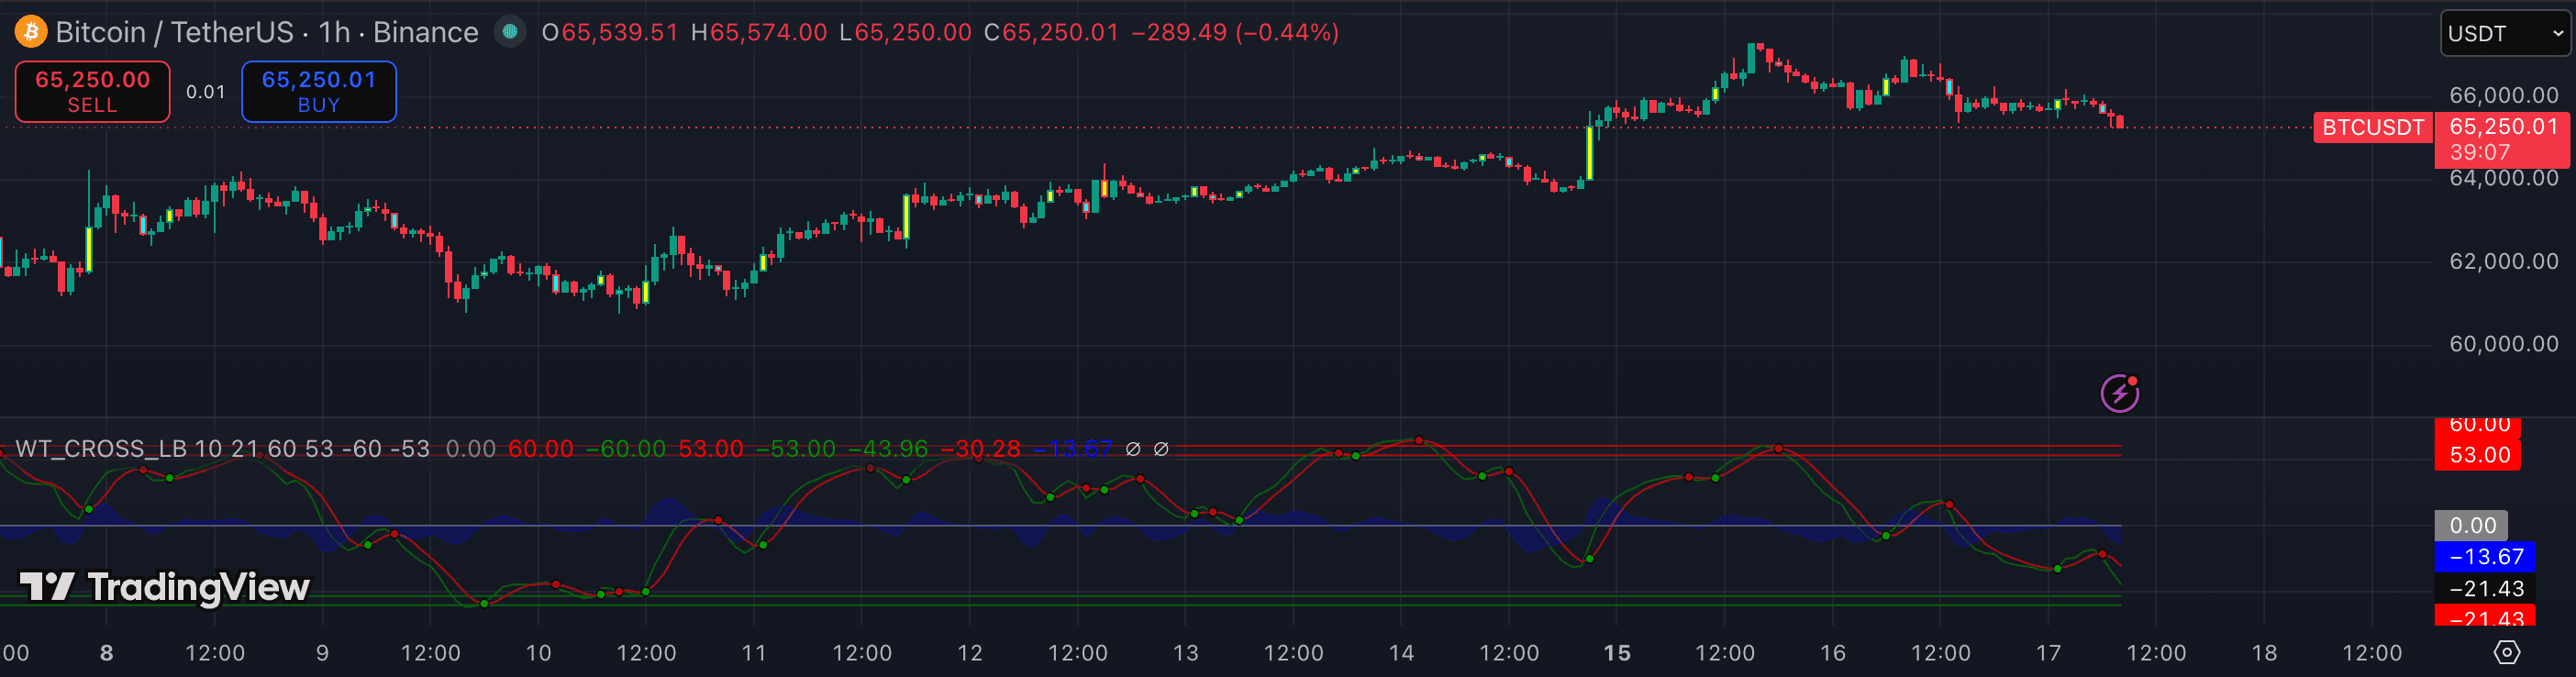
WaveTrend Oscillator
momentumFreeWaveTrend's smooth oscillator produces clean divergence signals with fewer false positives than raw Stochastic RSI. It is particularly effective at spotting hidden bullish divergence — price making a higher low while WaveTrend makes a lower low — which signals trend continuation after a pullback.
Best for: Mean-reversion scalpers on majors·TFs:15m1hRead review4.4/5 - 06RANK
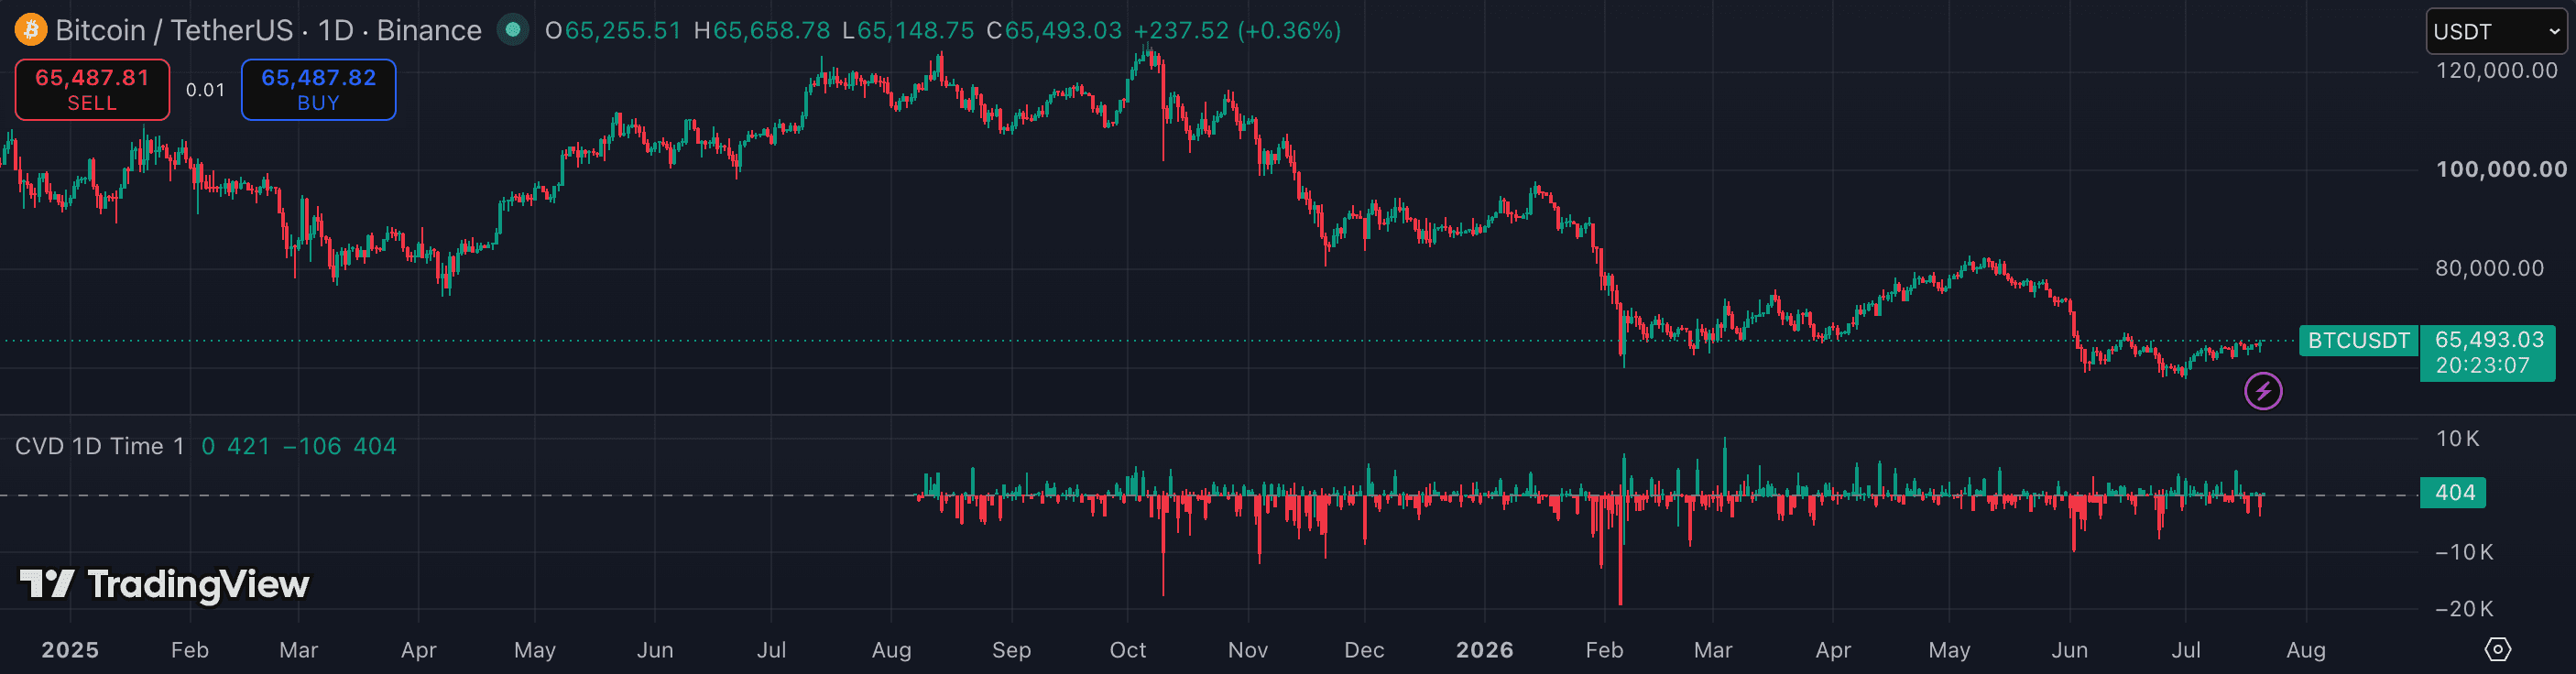
CVD (Cumulative Volume Delta)
volumeFreeCumulative Volume Delta divergence reveals order flow imbalances: when price rises but CVD declines, sellers are absorbing the buying pressure. This type of divergence indicates potential price weakness even during an apparent uptrend, and often precedes reversals missed by price-based oscillators.
Best for: Order flow traders who want to see the buying/selling pressure behind price·TFs:5m15m1hRead review4.4/5
The whole list, at a glance.
| # | Indicator | Category | Best timeframe | Pricing | Rating |
|---|---|---|---|---|---|
| 01 | RSI (Relative Strength Index) | momentum | 1h4h | Built-in | 4.3/5 |
| 02 | MACD | momentum | 1h4h1D | Built-in | 4.1/5 |
| 03 | OBV (On-Balance Volume) | volume | 1h4h1D | Built-in | 4.0/5 |
| 04 | Stochastic RSI | momentum | 15m1h4h | Built-in | 4.1/5 |
| 05 | WaveTrend Oscillator | momentum | 15m1h | Free | 4.4/5 |
| 06 | CVD (Cumulative Volume Delta) | volume | 5m15m1h | Free | 4.4/5 |
Related rankings
Not investment advice. PineRadar is an editorial directory — links may be affiliate. Always test indicators on a demo account.