The best TradingView indicators for trading crypto breakouts
Breakouts are the highest-reward but also highest-false-signal setup in crypto. The challenge is distinguishing a genuine expansion from a fake-out that traps breakout buyers. These indicators are the most useful for confirming that a breakout has real volume and momentum behind it before committing to a position. Educational content only; not investment advice.
- 01RANK
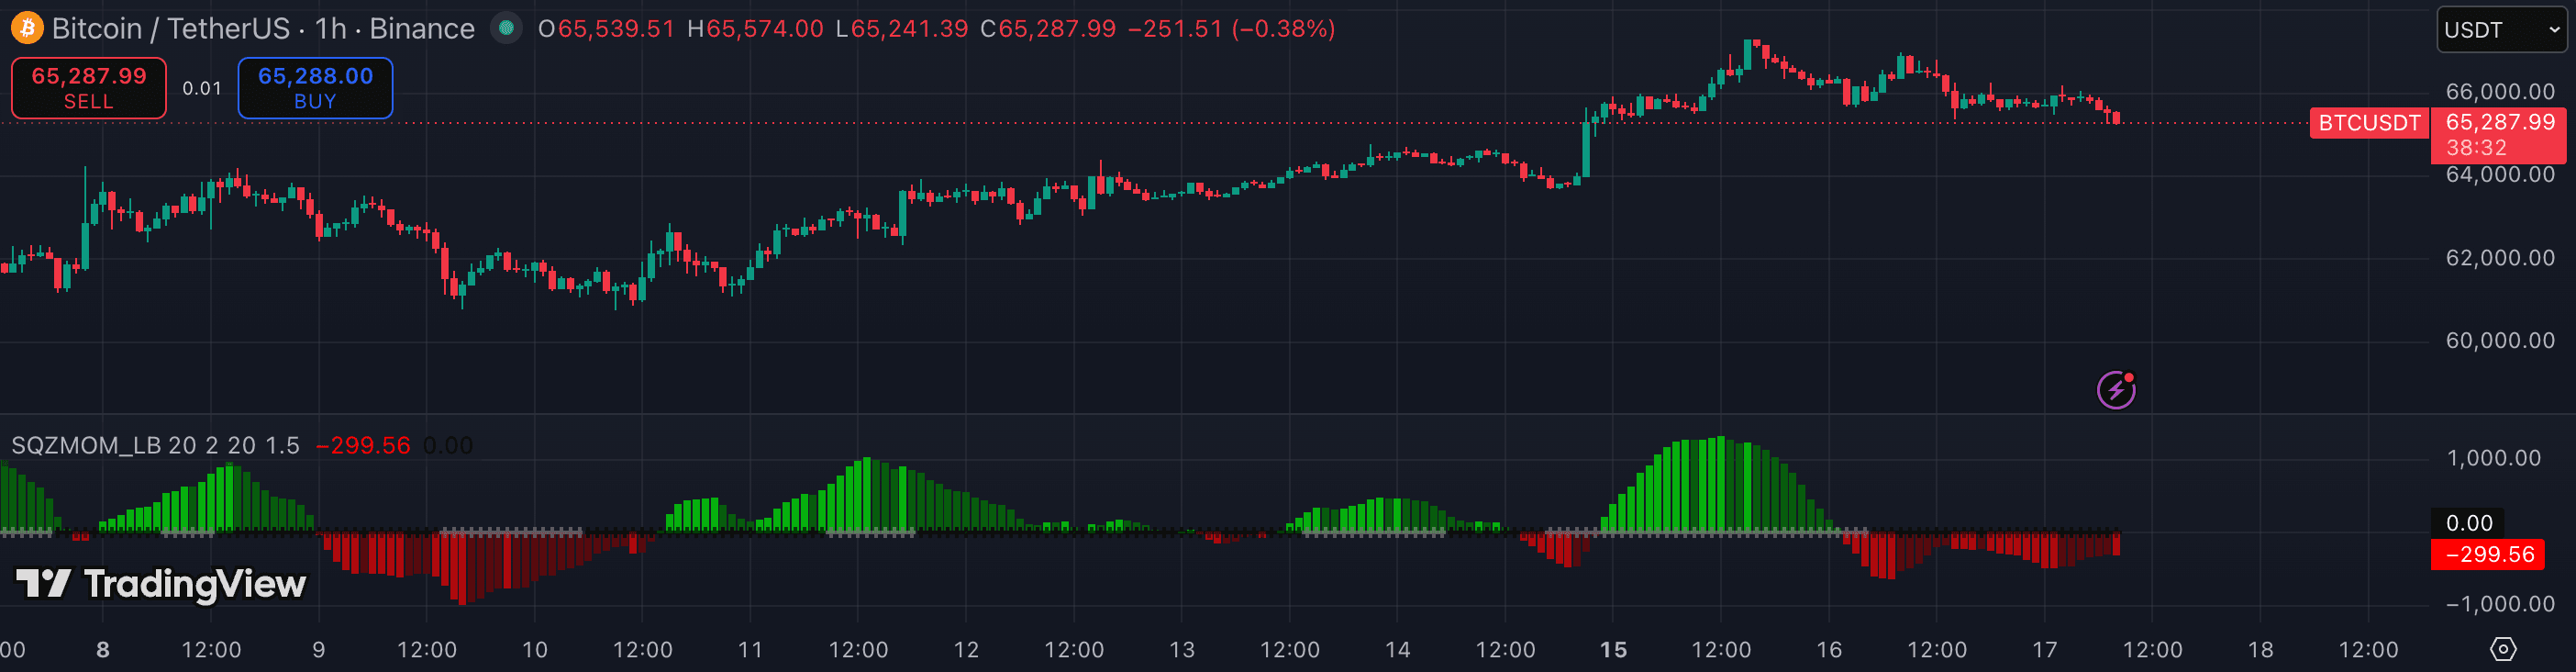
Squeeze Momentum
momentumFreeThe Squeeze Momentum indicator is built for exactly this: when Bollinger Bands contract inside Keltner Channels, volatility is coiling and a breakout is likely. When the squeeze fires, the histogram direction tells you which way the release is leaning — entering before the close of the first breakout bar is the core setup.
Best for: Breakout traders waiting for compression·TFs:1h4h1DRead review4.3/5 - 02RANK
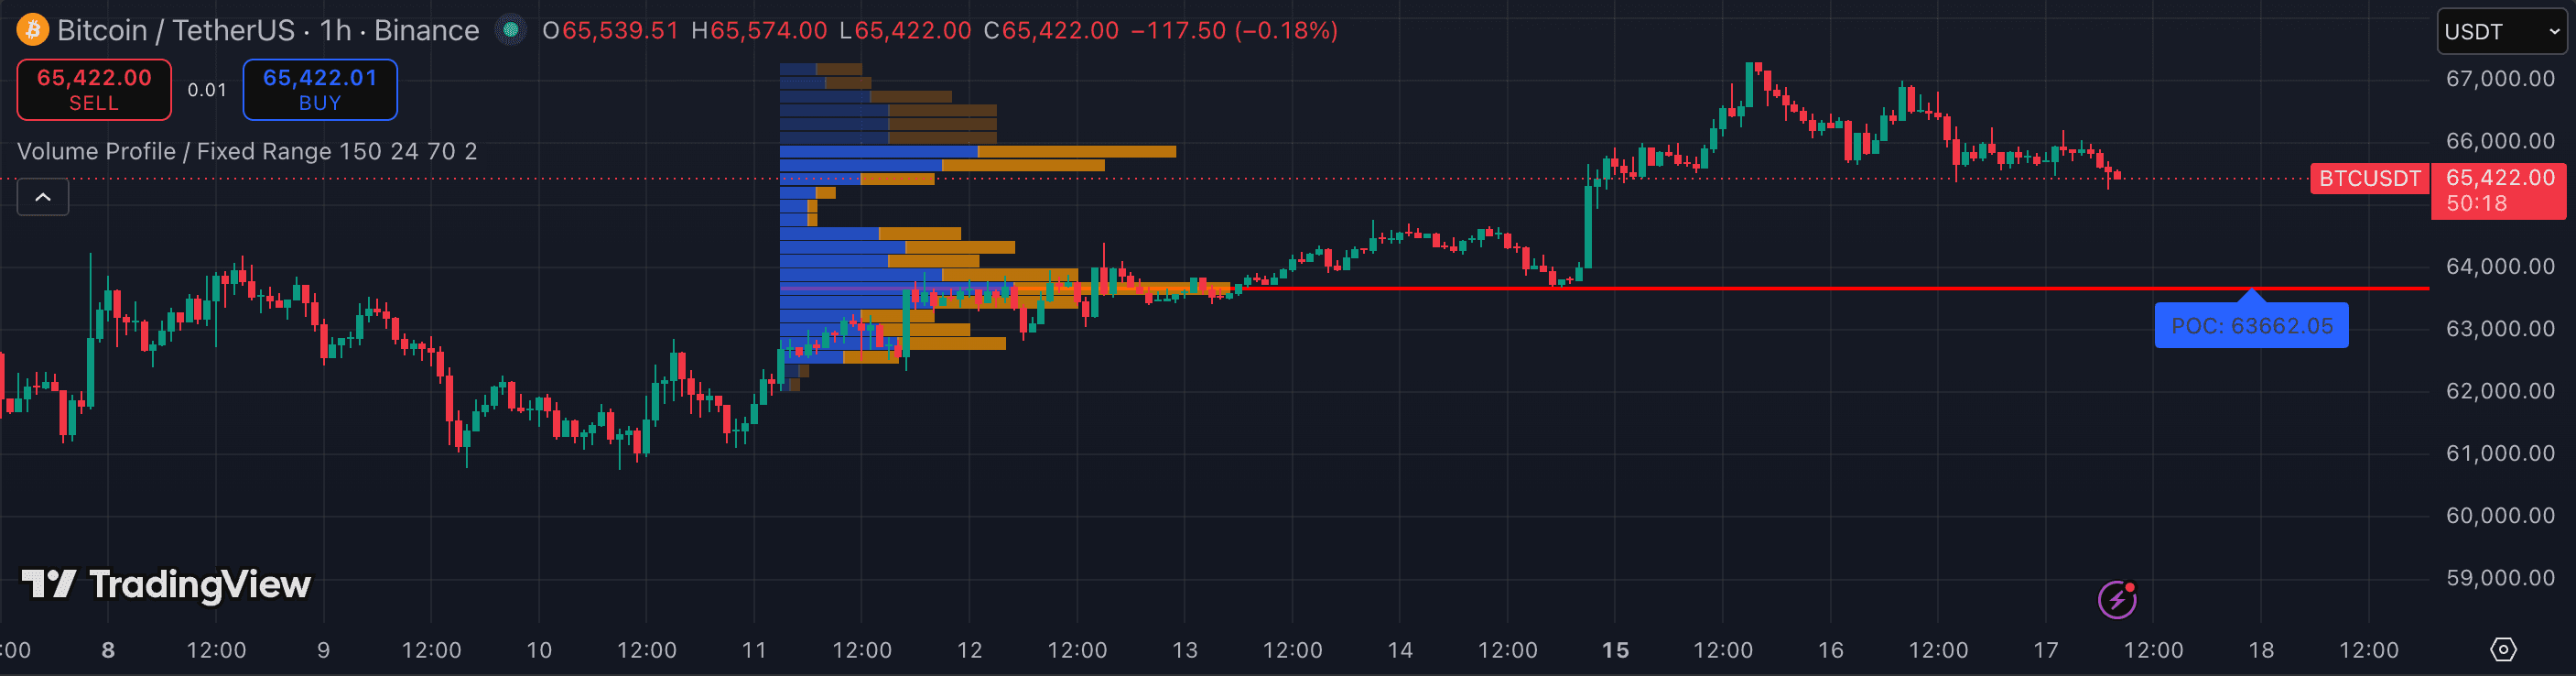
Volume Profile (Fixed Range)
volumeBuilt-inA breakout through a low-volume node (LVN) on the Volume Profile is one of the cleanest continuation signals in crypto. Price slices through LVNs quickly because little historical volume was traded there — the market has no memory at those levels. A breakout through an HVN is harder and more likely to stall.
Best for: Anyone trading levels, not candles·TFs:1h4h1DRead review4.7/5 - 03RANK
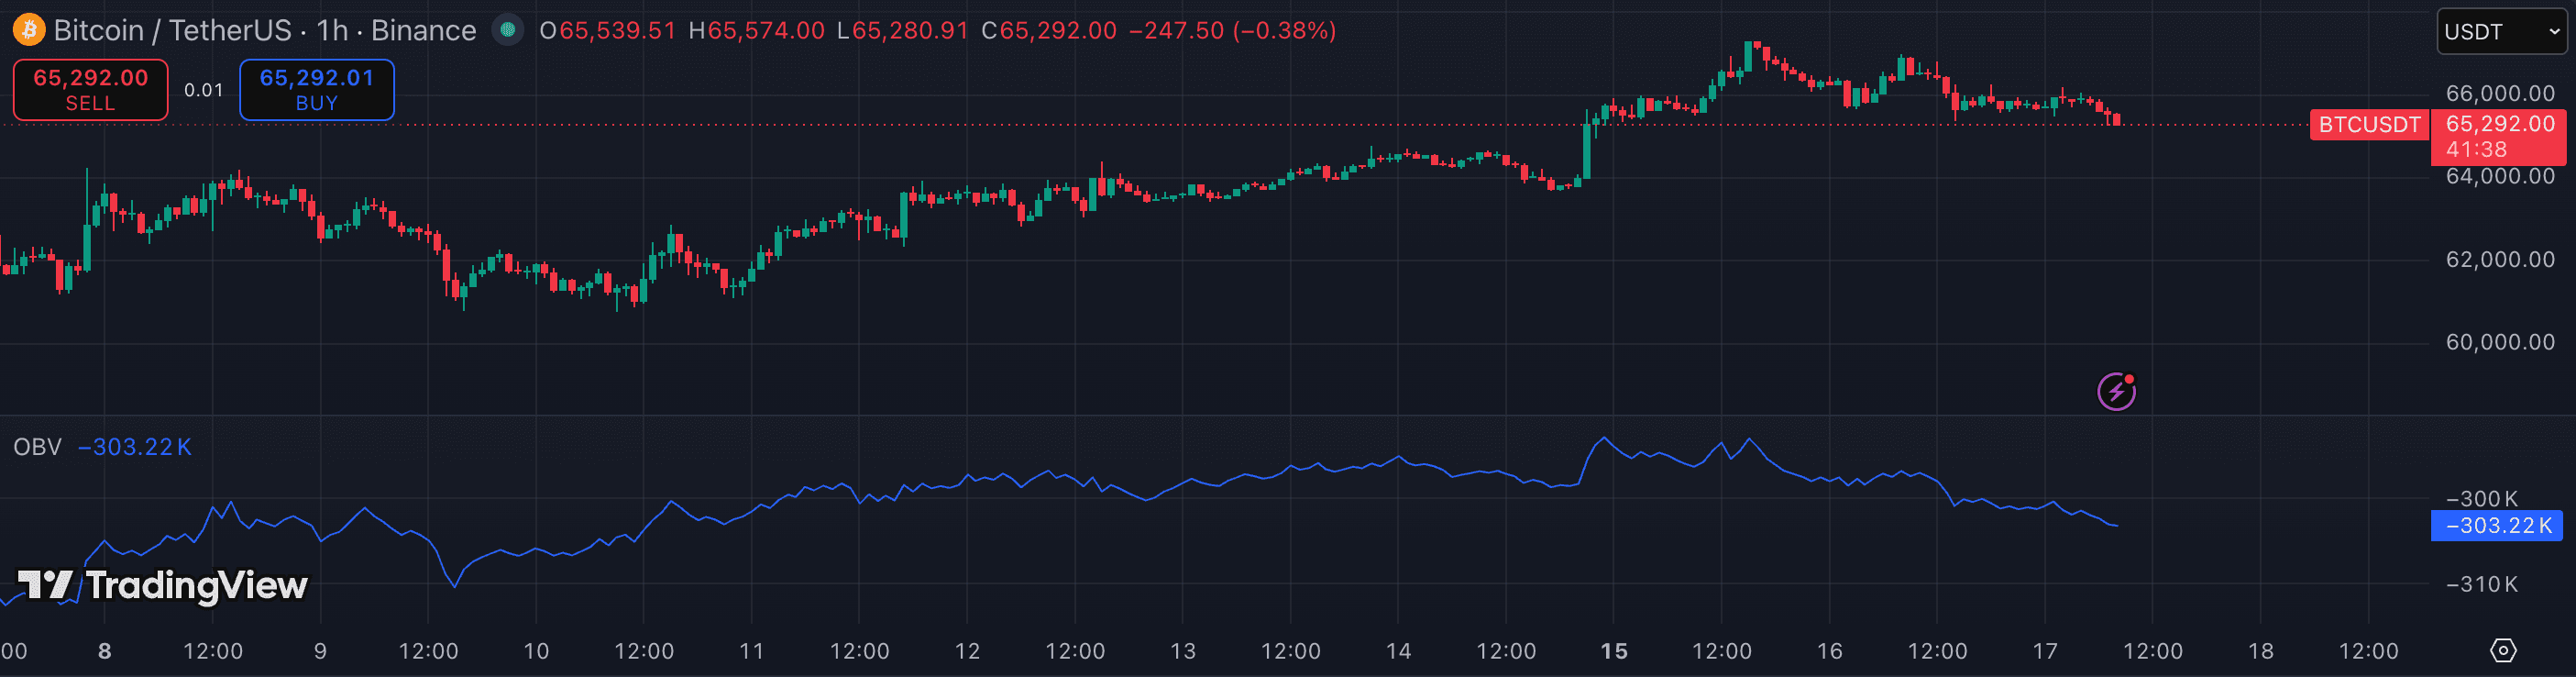
OBV (On-Balance Volume)
volumeBuilt-inOBV confirms whether a price breakout has genuine volume participation. A price breakout to new highs accompanied by OBV also making new highs is a confirmed, volume-backed move. Price breaking out while OBV stays flat or falls is a warning that the breakout lacks follow-through.
Best for: Traders confirming breakouts with volume·TFs:1h4h1DRead review4.0/5 - 04RANK
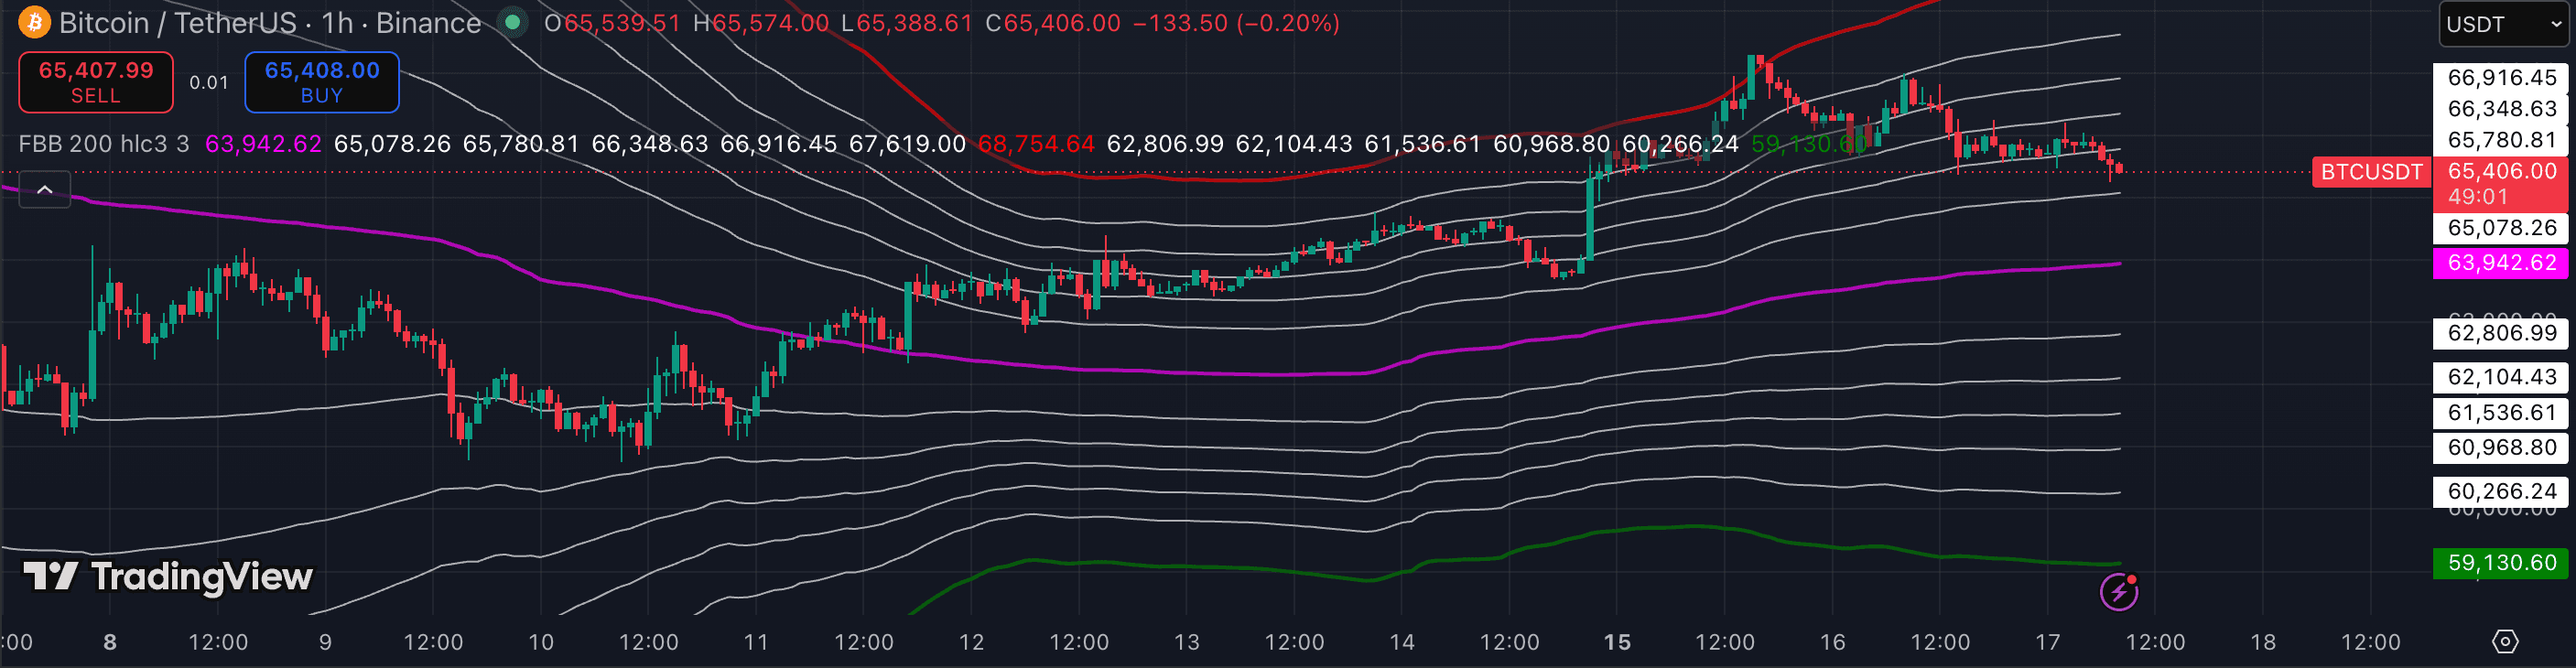
Bollinger Bands
volatilityBuilt-inA Bollinger Band squeeze followed by price closing outside the band on elevated candle range is the textbook breakout pattern. The band walk — price hugging the outer band for multiple bars — confirms the breakout has sustained momentum rather than reverting immediately to the mean.
Best for: Range traders reading volatility·TFs:15m1h4hRead review4.2/5 - 05RANK
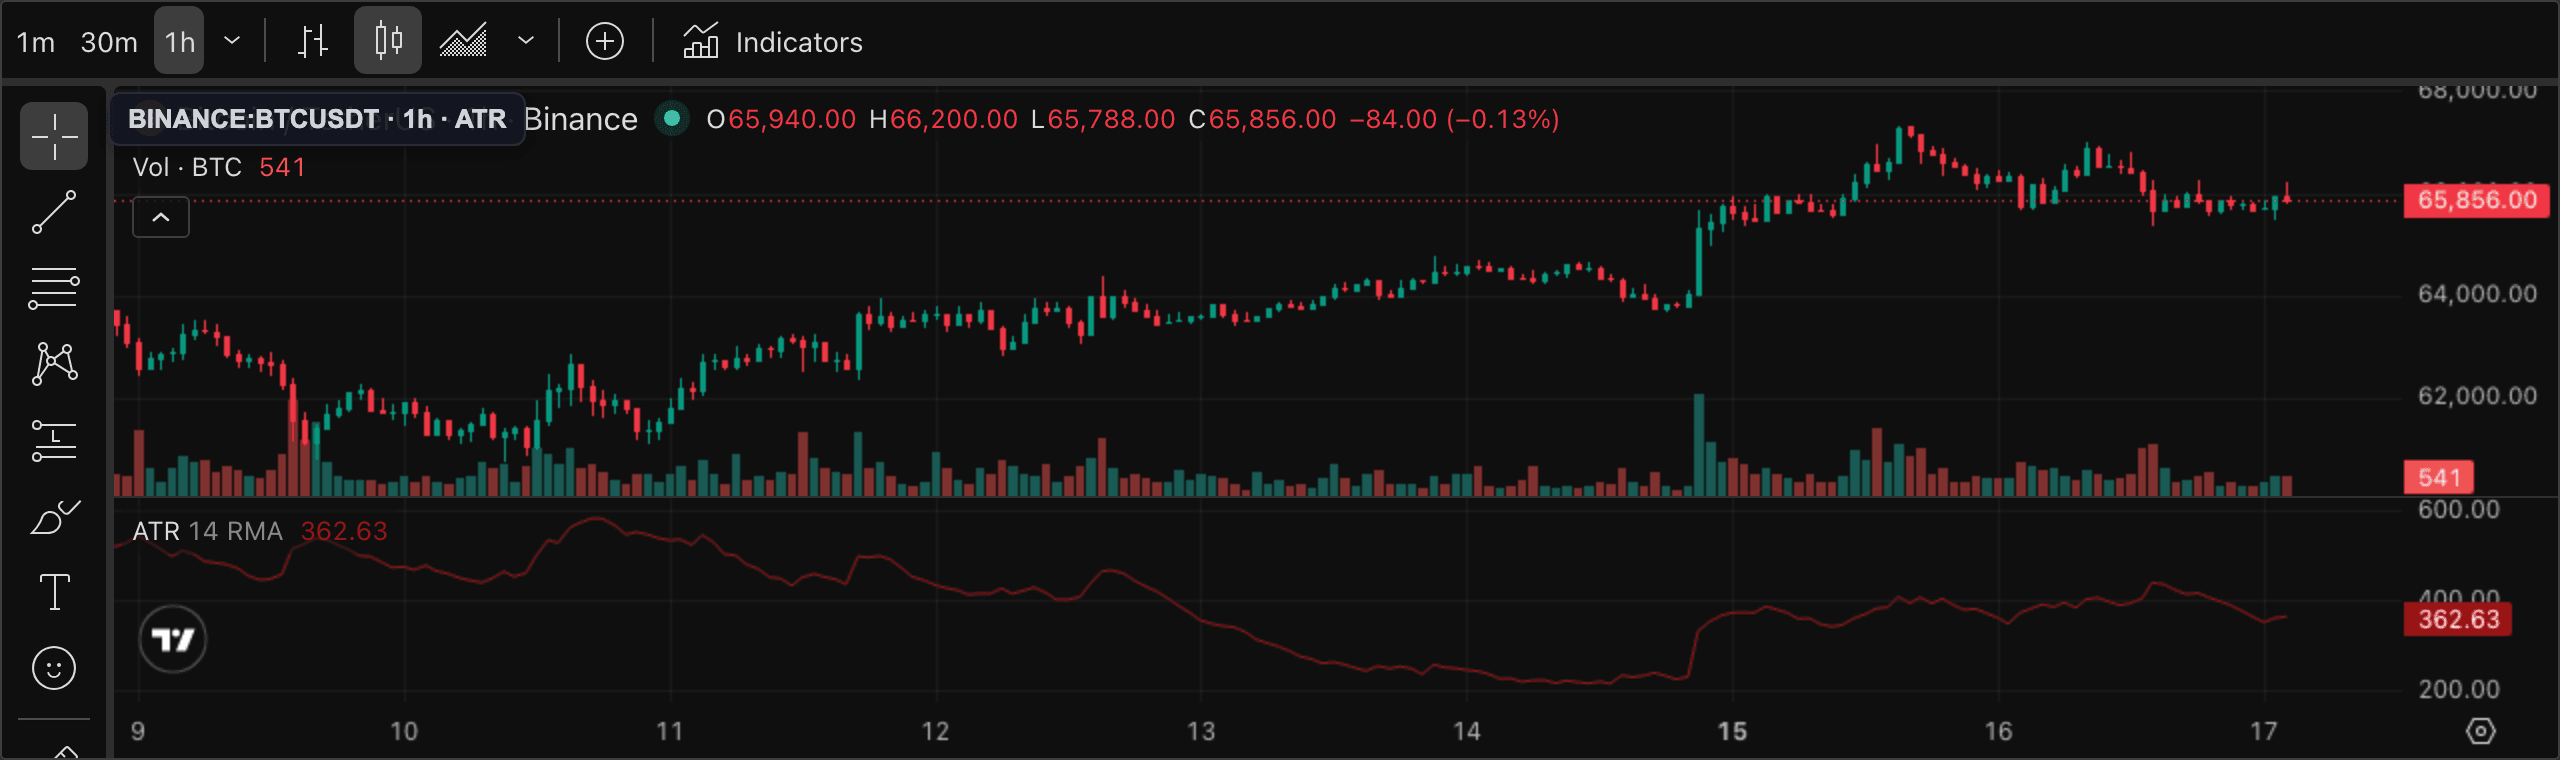
ATR (Average True Range)
volatilityBuilt-inATR tells you what a 'real' breakout candle looks like for a given pair and timeframe. If a breakout candle's range is 2×+ ATR, it has above-average expansion behind it. A breakout candle smaller than 0.5× ATR is a low-conviction move likely to retrace.
Best for: Anyone sizing stops and targets·TFs:15m1h4hRead review4.3/5 - 06RANK
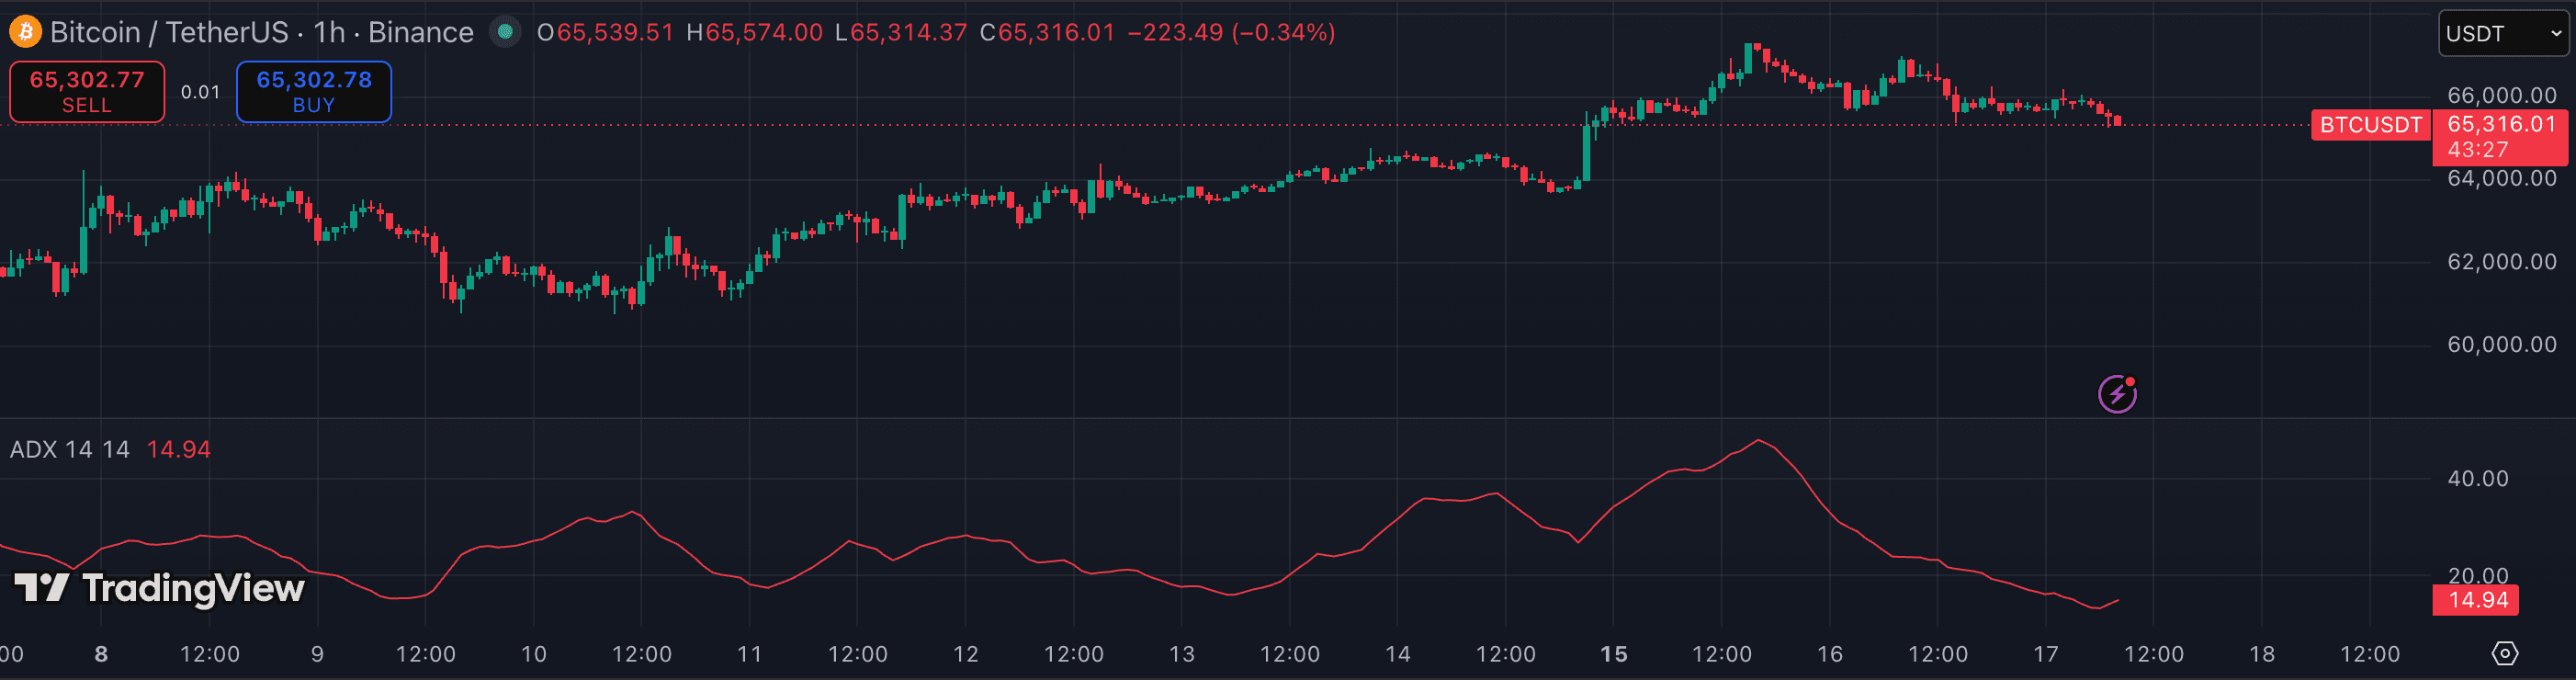
ADX (Average Directional Index)
trendBuilt-inADX rising above 20–25 as the breakout occurs confirms the move has directional strength rather than being a quick spike into a range. An ADX reading still below 20 on a breakout bar is a yellow flag — the market may not have enough trend energy to sustain the move.
Best for: Trend traders who want a chop filter·TFs:1h4h1DRead review4.1/5
The whole list, at a glance.
| # | Indicator | Category | Best timeframe | Pricing | Rating |
|---|---|---|---|---|---|
| 01 | Squeeze Momentum | momentum | 1h4h1D | Free | 4.3/5 |
| 02 | Volume Profile (Fixed Range) | volume | 1h4h1D | Built-in | 4.7/5 |
| 03 | OBV (On-Balance Volume) | volume | 1h4h1D | Built-in | 4.0/5 |
| 04 | Bollinger Bands | volatility | 15m1h4h | Built-in | 4.2/5 |
| 05 | ATR (Average True Range) | volatility | 15m1h4h | Built-in | 4.3/5 |
| 06 | ADX (Average Directional Index) | trend | 1h4h1D | Built-in | 4.1/5 |
Related rankings
Not investment advice. PineRadar is an editorial directory — links may be affiliate. Always test indicators on a demo account.