OBVvsMACD
OBV and MACD are two of the most widely used technical indicators, but they measure completely different things: OBV tracks whether volume is flowing into or out of an asset, while MACD measures price momentum through moving average divergence. Understanding when each gives reliable signals — and when they confirm each other — is one of the most practical edges a discretionary trader can develop.
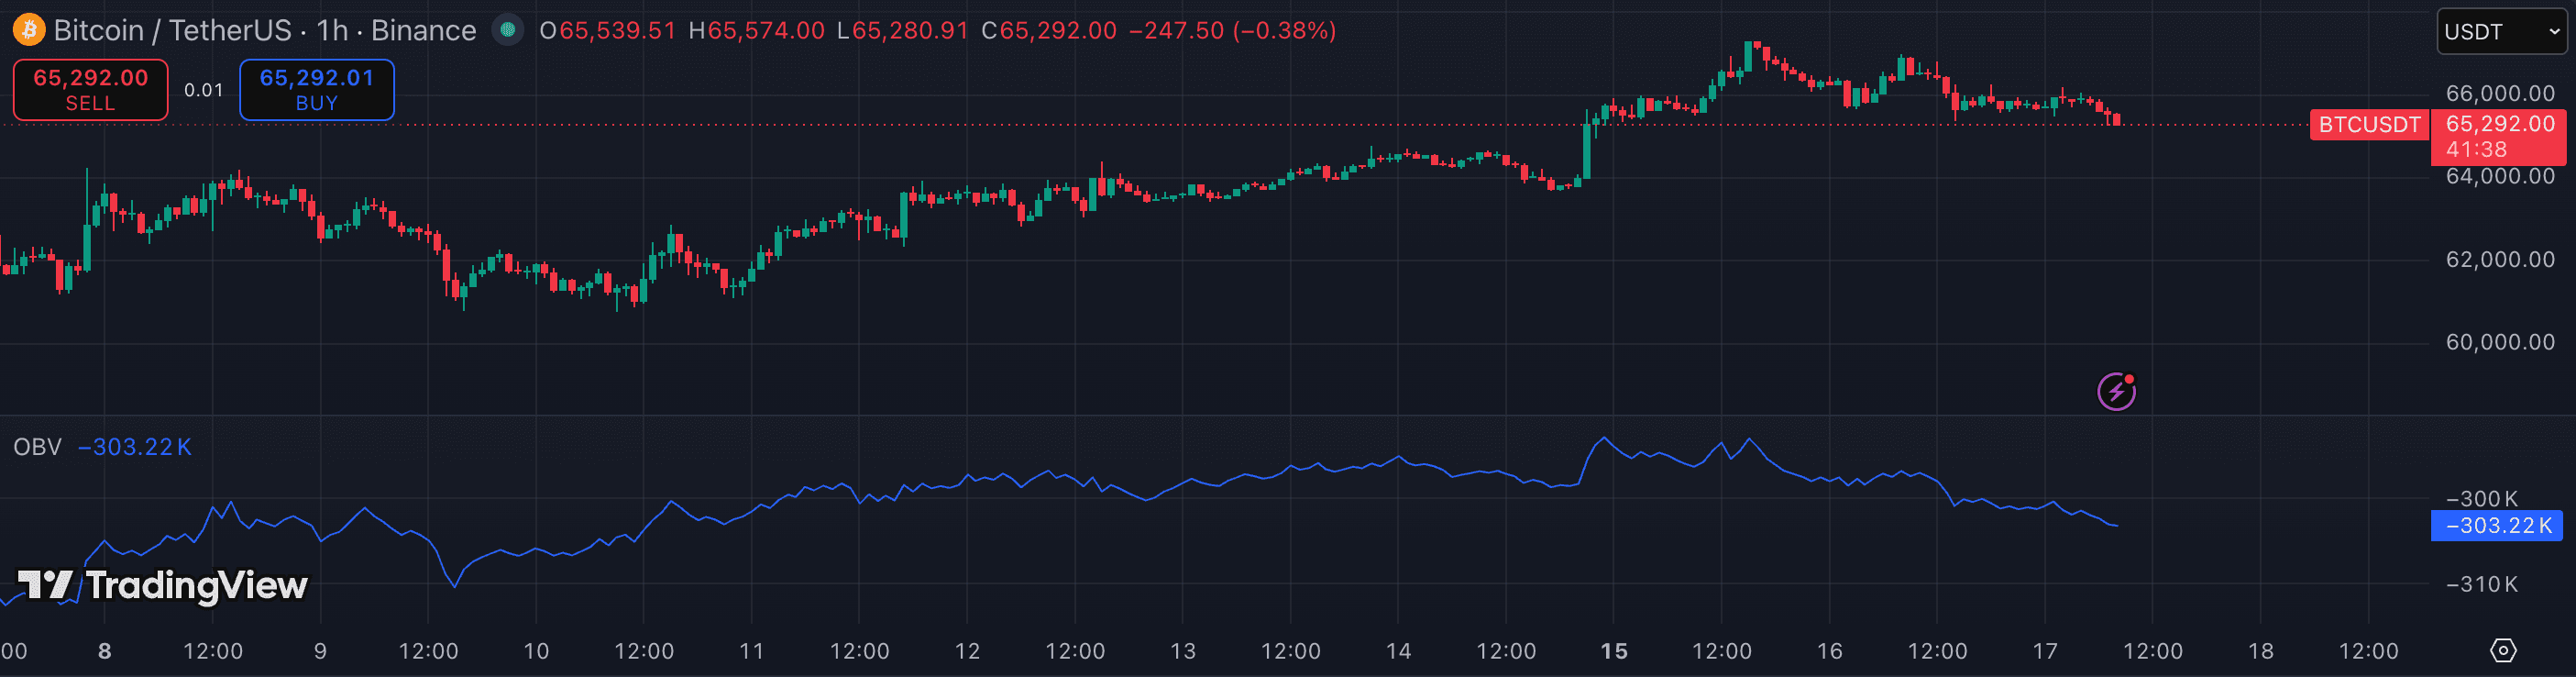
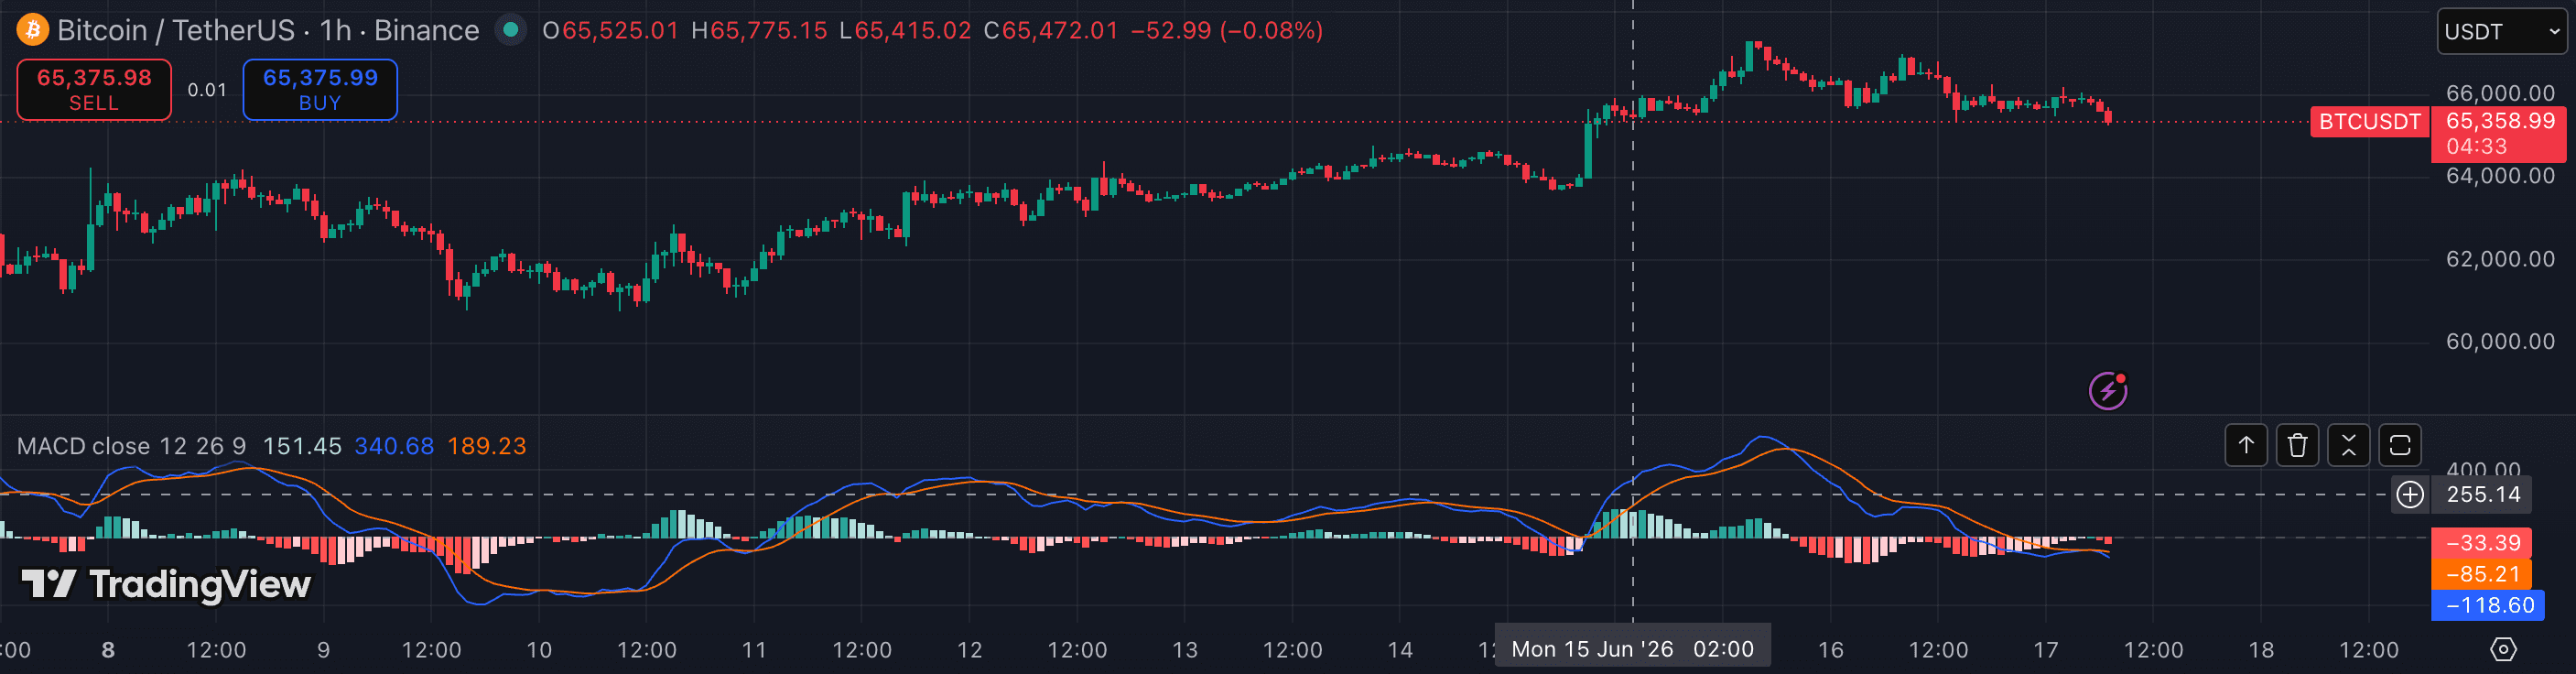
The attributes that matter.
| Attribute | OBV | MACD |
|---|---|---|
| Category | Volume (cumulative flow) | Momentum (price-based) |
| Inputs | Price direction + volume per bar | Price closing values only |
| Output | Cumulative running total (OBV line) | MACD line, signal line, histogram |
| Lead / lag | Can lead price — volume often moves before price | Lags price — derived from historical closes |
| Divergence utility | High — rising OBV with falling price = accumulation signal | High — MACD divergence from price is a classic reversal filter |
| Best timeframe | 4h · 1D — higher timeframes smooth volume noise | 1h · 4h · 1D for trend and momentum signals |
| Best for | Confirming breakouts, spotting smart-money accumulation or distribution | Trend confirmation, momentum shifts, zero-line crossovers |
| Works in ranging markets? | Partially — OBV still tracks flow but signals are less clean | Poorly — gives false crossovers; filter with ADX |
Which should you choose?
OBV's edge is that it incorporates volume, which price-only indicators ignore. When OBV is making new highs alongside price, the breakout has institutional backing. When price makes a new high but OBV does not, the move is happening on declining volume — a classic distribution signal that often precedes a reversal. This divergence pattern is OBV's most practical application.
MACD is a momentum indicator: it shows whether the trend is accelerating or decelerating. A MACD zero-line crossover confirms trend direction; histogram expansion confirms momentum. Because MACD is entirely price-derived, it is vulnerable to whipsaws in choppy markets — the standard fix is to only trade MACD signals when ADX confirms a trend exists.
Used together, OBV and MACD provide a volume-plus-momentum confirmation framework: a MACD crossover with rising OBV is more reliable than either signal alone. When they diverge — MACD bullish but OBV falling — treat the trade with caution. Neither indicator replaces the other, and combining their signals is a practical way to reduce false entries in trending markets.
- You want to detect whether volume supports the current price move
- You trade breakouts and need confirmation that institutional flow is participating
- You analyse on 4h or daily charts where volume data is most meaningful
- You need momentum confirmation for trend trades on 1h or 4h
- You want a clean signal line crossover to time entries with
- You are in a strong trend and need a trailing momentum filter to stay in the move
Other comparisons
Not investment advice. PineRadar is an editorial directory — links may be affiliate. Always test indicators on a demo account.