SqueezevsRSI
Both Squeeze Momentum and RSI live in the momentum family, but they answer different questions. RSI tells you how overbought or oversold price is right now; Squeeze Momentum tells you when a coiled market is about to release energy and in which direction. Understanding that distinction stops traders from using them interchangeably — and unlocks a powerful pairing.
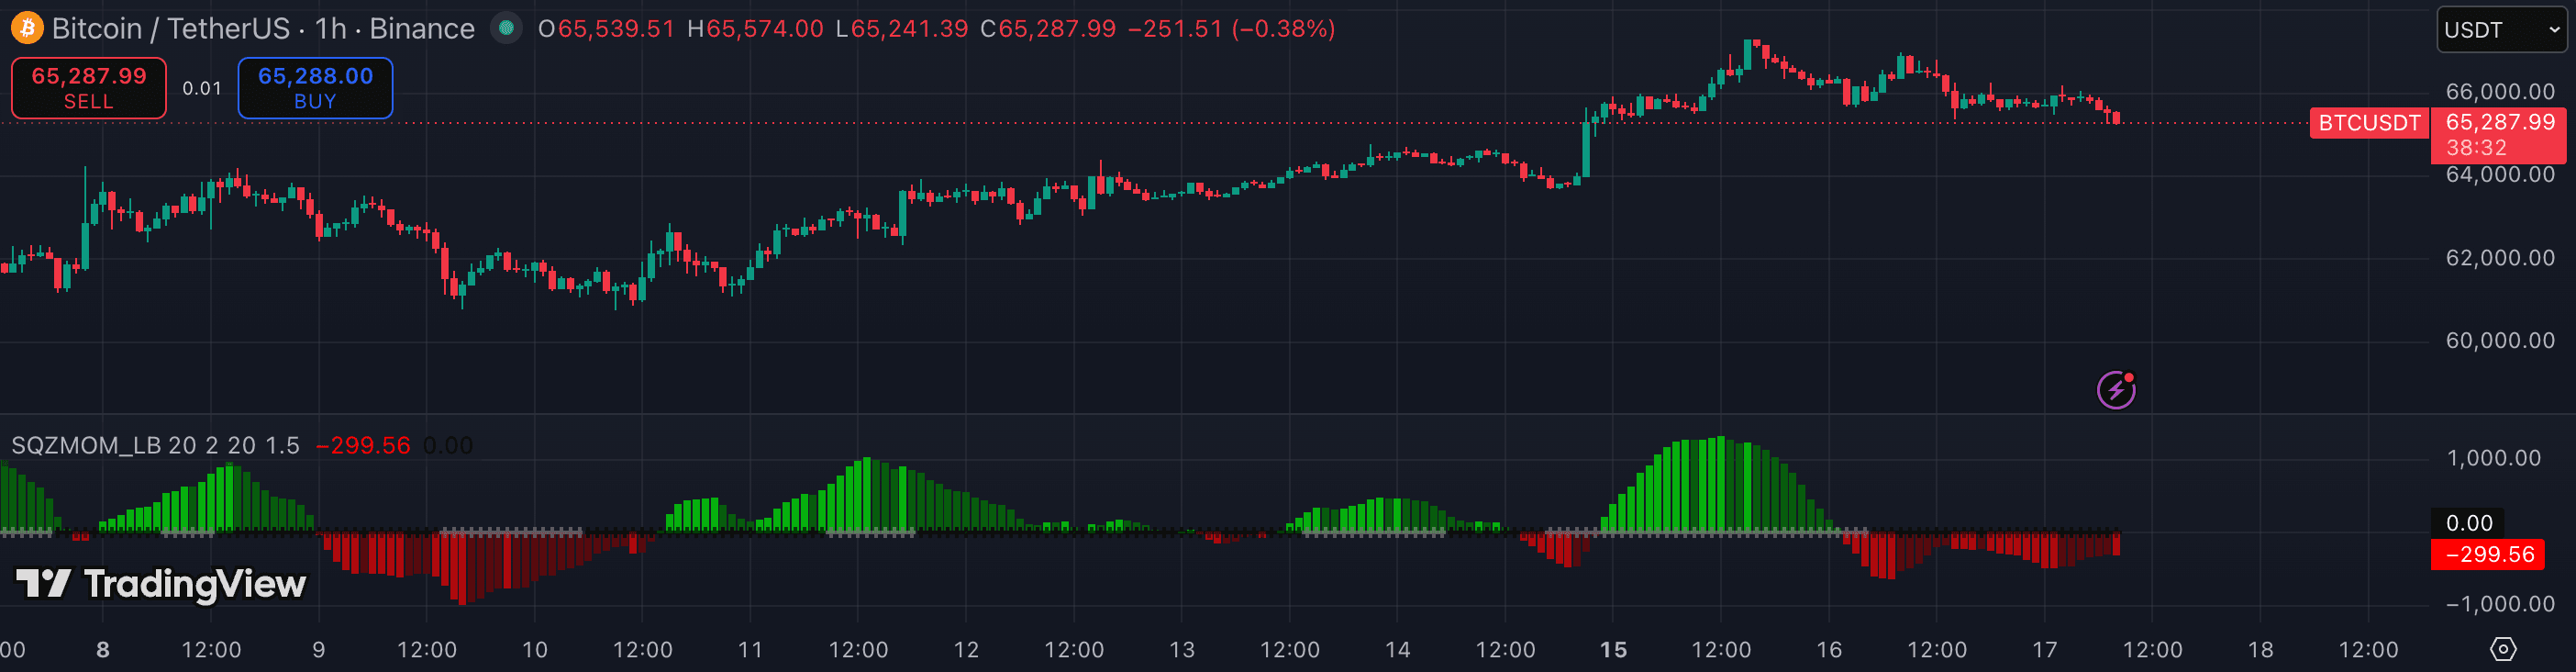
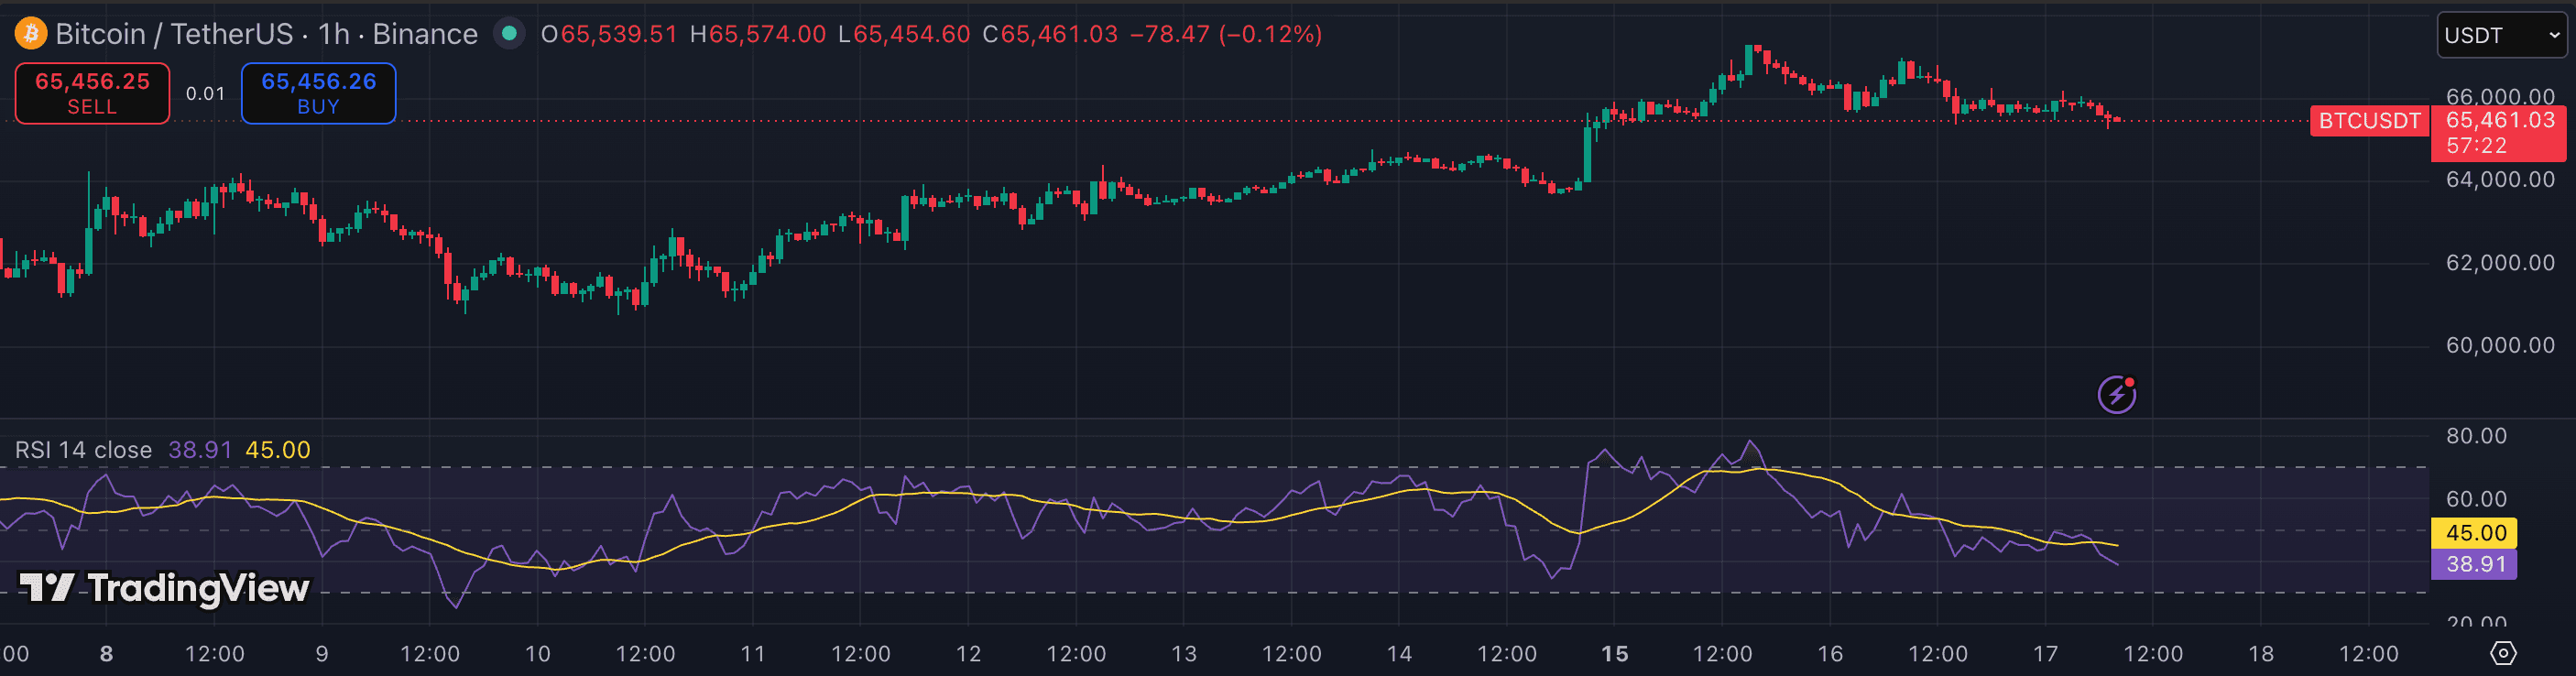
The attributes that matter.
| Attribute | Squeeze | RSI |
|---|---|---|
| Category | Momentum + volatility | Momentum oscillator |
| Core mechanic | BB/KC squeeze + histogram | Relative price change (0–100) |
| Default period | BB 20 · KC 20 | Length 14 |
| Best timeframe | 1h · 4h · 1D | 1h · 4h |
| Lag | Low on squeeze fire | Low (reactive) |
| Extreme-level signals | ★★☆☆☆ | ★★★★☆ |
| Divergence quality | ★★☆☆☆ | ★★★★☆ |
| Best for | Pre-breakout compression detection | Overbought/oversold reversals & divergence |
| Worst in | Trending markets (no squeeze fires) | Strong trends (stays extreme without reverting) |
Which should you choose?
Squeeze Momentum is a setup-timing tool: it waits for volatility to compress (red dots), then signals when momentum is building and which direction it leans. RSI is a relative-strength gauge: it shows when price is stretched versus its recent history, making it useful for spotting exhaustion and divergence.
The cleanest use of both is layered — wait for Squeeze Momentum's red dots to signal compression and then watch RSI for divergence as the squeeze fires. An RSI below 50 while Squeeze Momentum histogram turns red is a stronger short setup than either alone. Neither indicator predicts direction with certainty; they are filters that raise the quality of setups, not guarantees.
- You trade breakouts from consolidation and want to enter before the crowd
- You focus on 4h–1D timeframes where compression setups are meaningful
- You want a single visual that combines volatility and momentum state
- You trade reversals at extended price levels using overbought/oversold readings
- You rely on divergence to time entries against the trend
- You trade multiple assets and need a simple 0–100 read that's easy to compare
Other comparisons
Not investment advice. PineRadar is an editorial directory — links may be affiliate. Always test indicators on a demo account.