OBVvsVWAP
Both are volume-based tools, but they measure completely different things. OBV tracks cumulative directional volume flow; VWAP measures the volume-weighted average price for the session. Knowing which one to use — and when — separates disciplined volume analysis from noise.
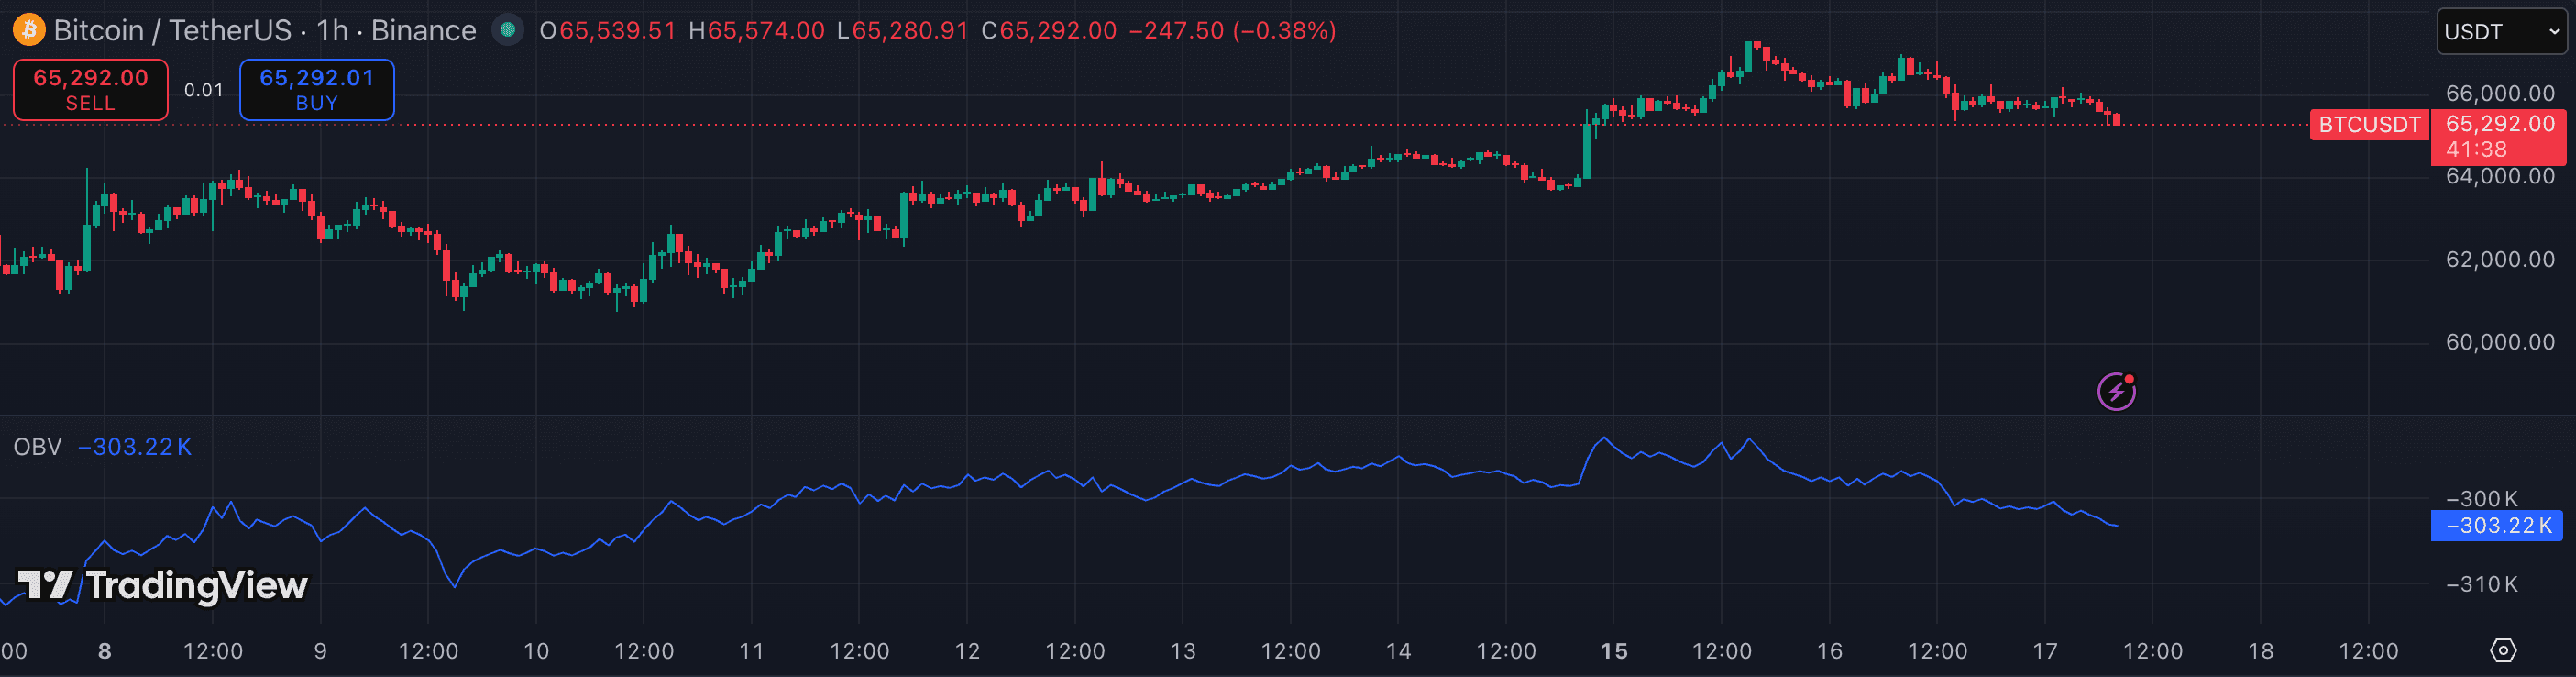
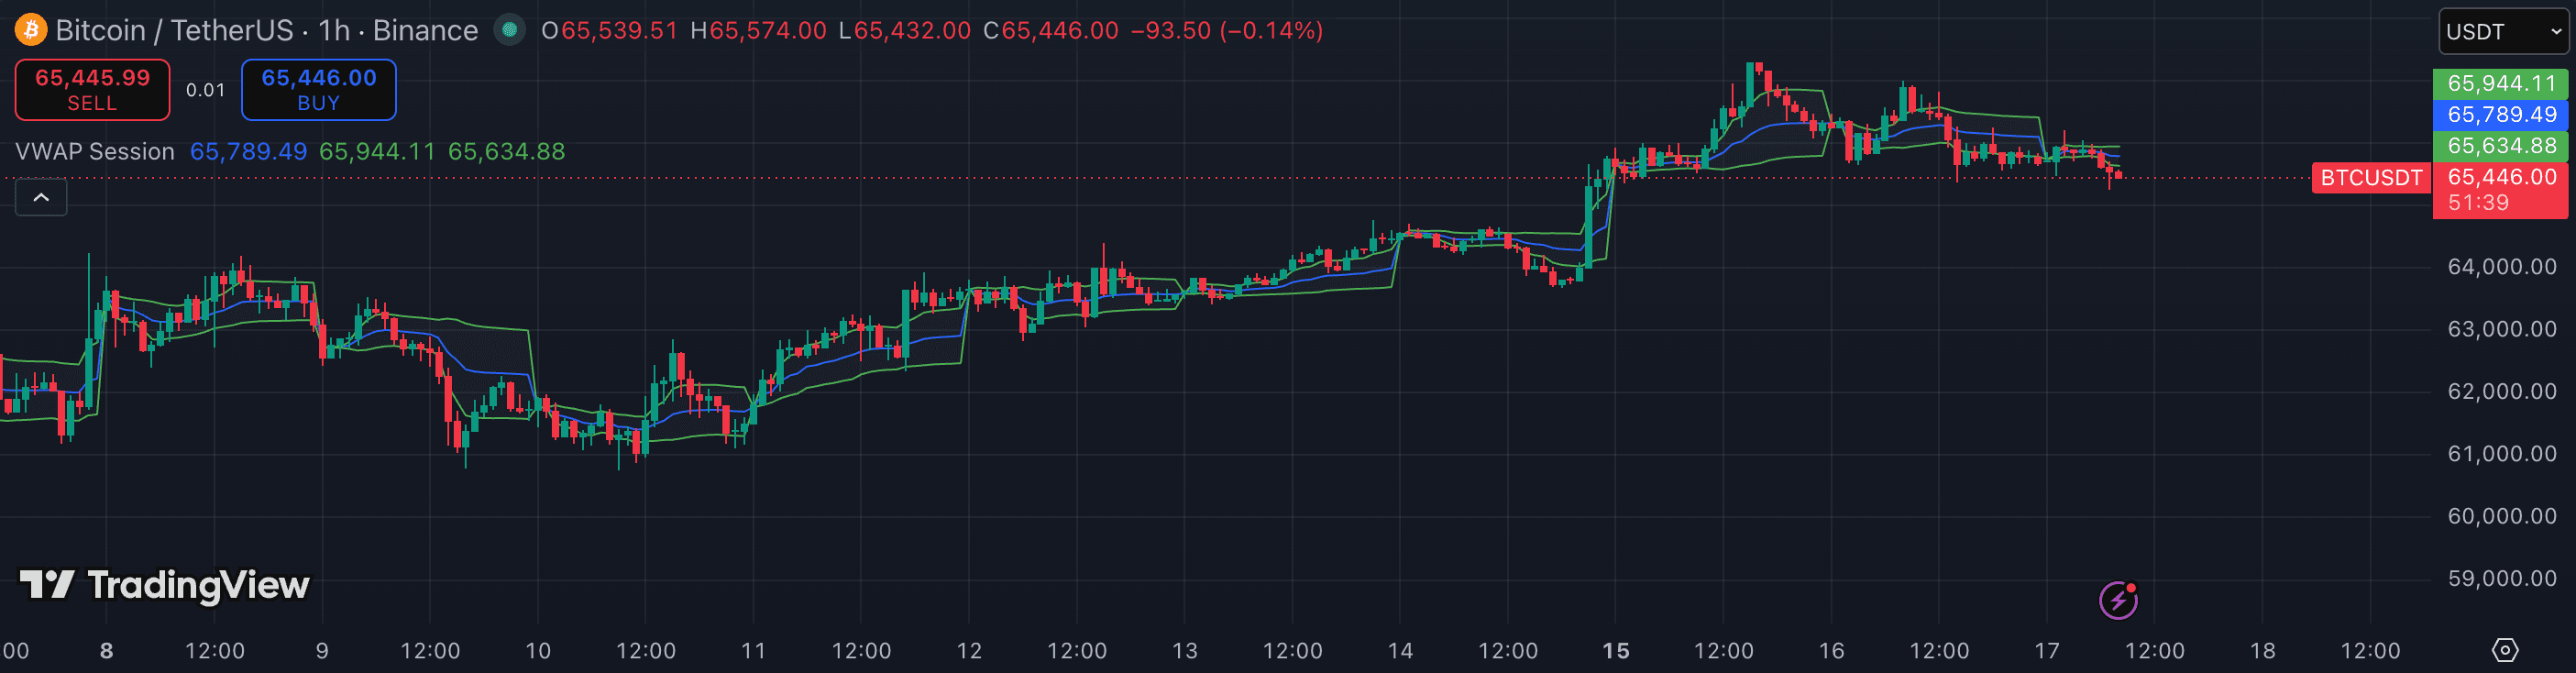
The attributes that matter.
| Attribute | OBV | VWAP |
|---|---|---|
| Category | Volume | Volume |
| Output | Cumulative running line | Price level (overlay) |
| Measures | Directional volume accumulation | Volume-weighted average price |
| Resets | Never (continuous) | Each session |
| Best timeframe | 1h · 4h · 1D | 1m · 5m · 15m · 1h |
| Best use | Divergence — confirm or contradict price moves | Intraday bias and S/R |
| Worst in | Choppy, low-conviction tape | Swing or position trading — resets daily |
| Institutionally watched | Somewhat | Yes — heavily used by algos and market makers |
Which should you choose?
OBV is a divergence tool: its value is in comparing its direction to price. If price makes a new high but OBV doesn't, the breakout lacks volume participation and is suspect. That divergence read works on any timeframe but is most reliable on 1h and above where individual candles carry enough volume to be meaningful.
VWAP is a real-time pricing tool: it tells you where the average participant entered for the session, which is why institutions benchmark fills to it. A price reclaim of VWAP from below is a bullish intraday shift; a rejection off VWAP from above is a bearish one. The level is self-fulfilling because so many participants watch it.
They are not substitutes — they answer different questions. OBV tells you whether volume is confirming a multi-bar move. VWAP tells you where fair value is for the current session and creates intraday S/R. The clearest combined use: watch VWAP for intraday entry points and OBV to confirm whether volume is backing the move into or away from VWAP.
- You want to confirm whether a breakout is backed by real volume
- You trade multi-day swings where session resets are irrelevant
- You need a divergence signal to time exhaustion
- You day-trade or scalp intraday on 1m–1h
- You want a price-based S/R level, not a volume line
- You need the level that institutions and algos actually watch
Other comparisons
Not investment advice. PineRadar is an editorial directory — links may be affiliate. Always test indicators on a demo account.