Bollinger BandsvsATR
Bollinger Bands and ATR both measure volatility — but one puts it on the chart as a visual envelope, the other converts it into a plain number you use for risk management. They're complementary tools, not alternatives, yet traders constantly ask which one to use. Here's the clear-headed answer.
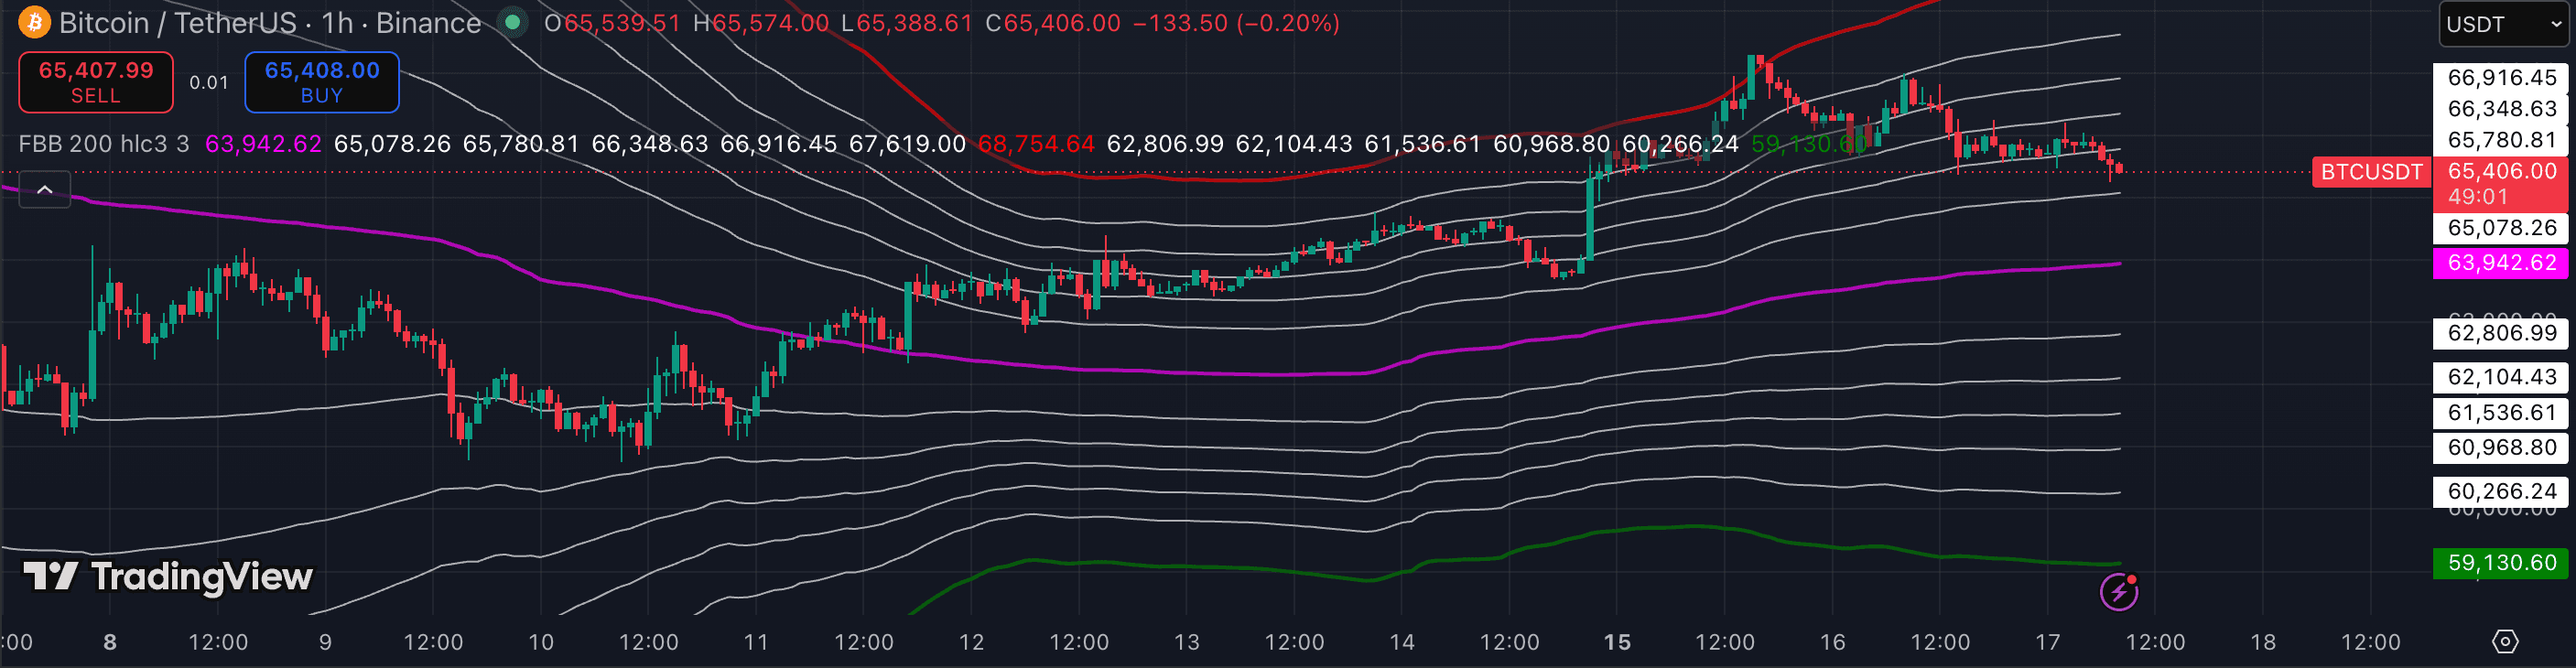
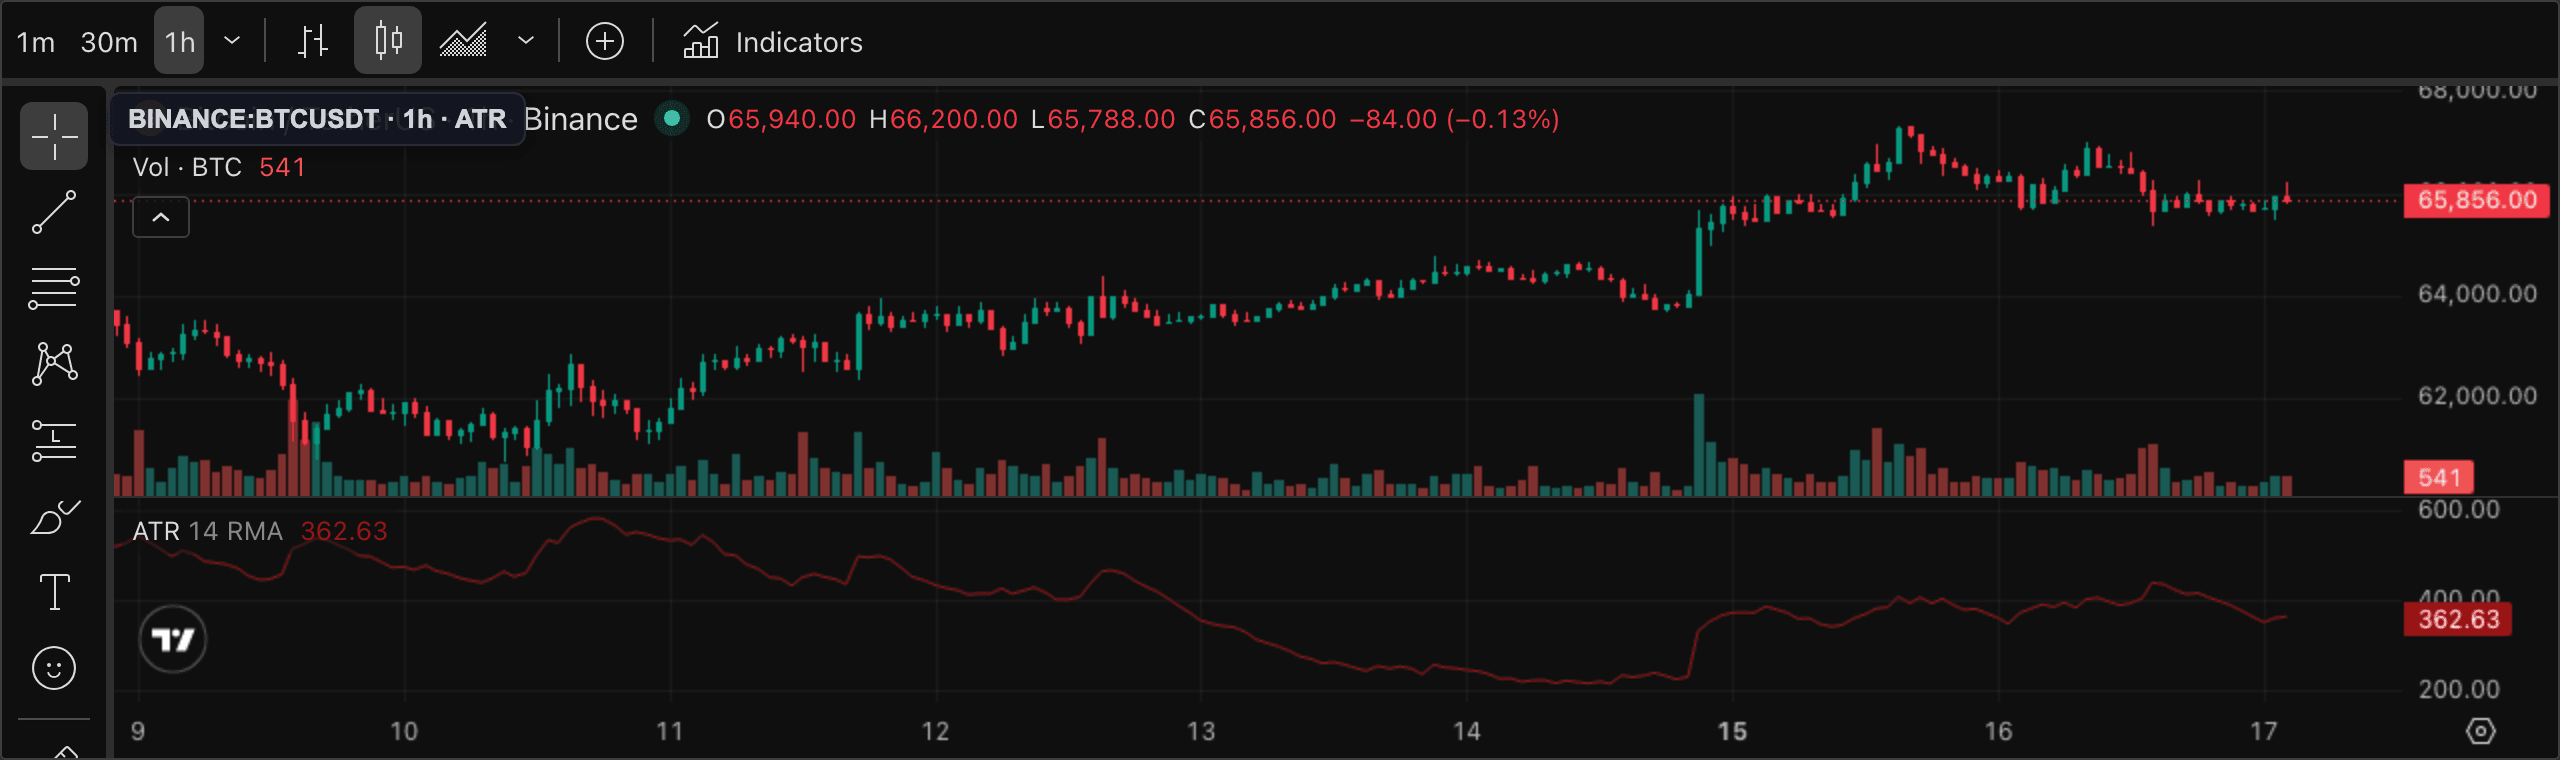
The attributes that matter.
| Attribute | Bollinger Bands | ATR |
|---|---|---|
| Category | Volatility (visual) | Volatility (numerical) |
| Output | Upper/middle/lower bands on price chart | Single value in price units |
| Calculation basis | 20-period SMA ± 2 standard deviations | 14-period average of true range |
| Shows direction? | No — envelope width only | No — magnitude only |
| Squeeze detection | Yes — band width compresses visually | Indirectly — low ATR = compression |
| Best for | Mean-reversion entries, breakout confirmation, S/R zones | Sizing stops, setting targets, volatility-adjusting position size |
| Best timeframe | 1h · 4h · 1D | 15m · 1h · 4h · 1D |
| Used by | Price-action traders, breakout traders | Every trader who manages risk quantitatively |
Which should you choose?
Bollinger Bands make volatility visible: the band width shows you at a glance whether the market is compressed or expanding, and the upper/lower bands act as dynamic S/R that prices mean-revert to. That visual quality makes BBs excellent for spotting squeeze setups and judging whether a price touch at the band is an exhaustion signal or a continuation.
ATR makes volatility actionable for risk management: it gives you a plain number — 'this asset is moving $X per bar on average' — which you use to set your stop distance and position size. A 1.5× ATR stop breathes with the market; a fixed-dollar stop ignores whether the asset is in a low-vol grind or a high-vol impulse.
The practical setup runs both. Bollinger Bands go on the price chart for visual context and mean-reversion signals. ATR sits in a separate pane as a risk input. They answer different questions — one is a charting tool, the other is a math input — which is why the 'which one should I use?' framing misses the point.
- You want a visual signal for mean-reversion or breakout entries
- You trade range-bound markets and want dynamic S/R levels
- You use squeeze setups (BB + Keltner combination)
- You need an objective number for sizing stops and targets
- You're building or tuning a system that adapts to volatility
- You already have entry signals and just need a risk ruler
Other comparisons
Not investment advice. PineRadar is an editorial directory — links may be affiliate. Always test indicators on a demo account.