RSIvsMACD
Three momentum oscillators, constantly compared — RSI, MACD, and Stochastic. Each measures something slightly different. Here is how to decide which one belongs on your crypto chart, and when running two of them makes more sense than picking just one.
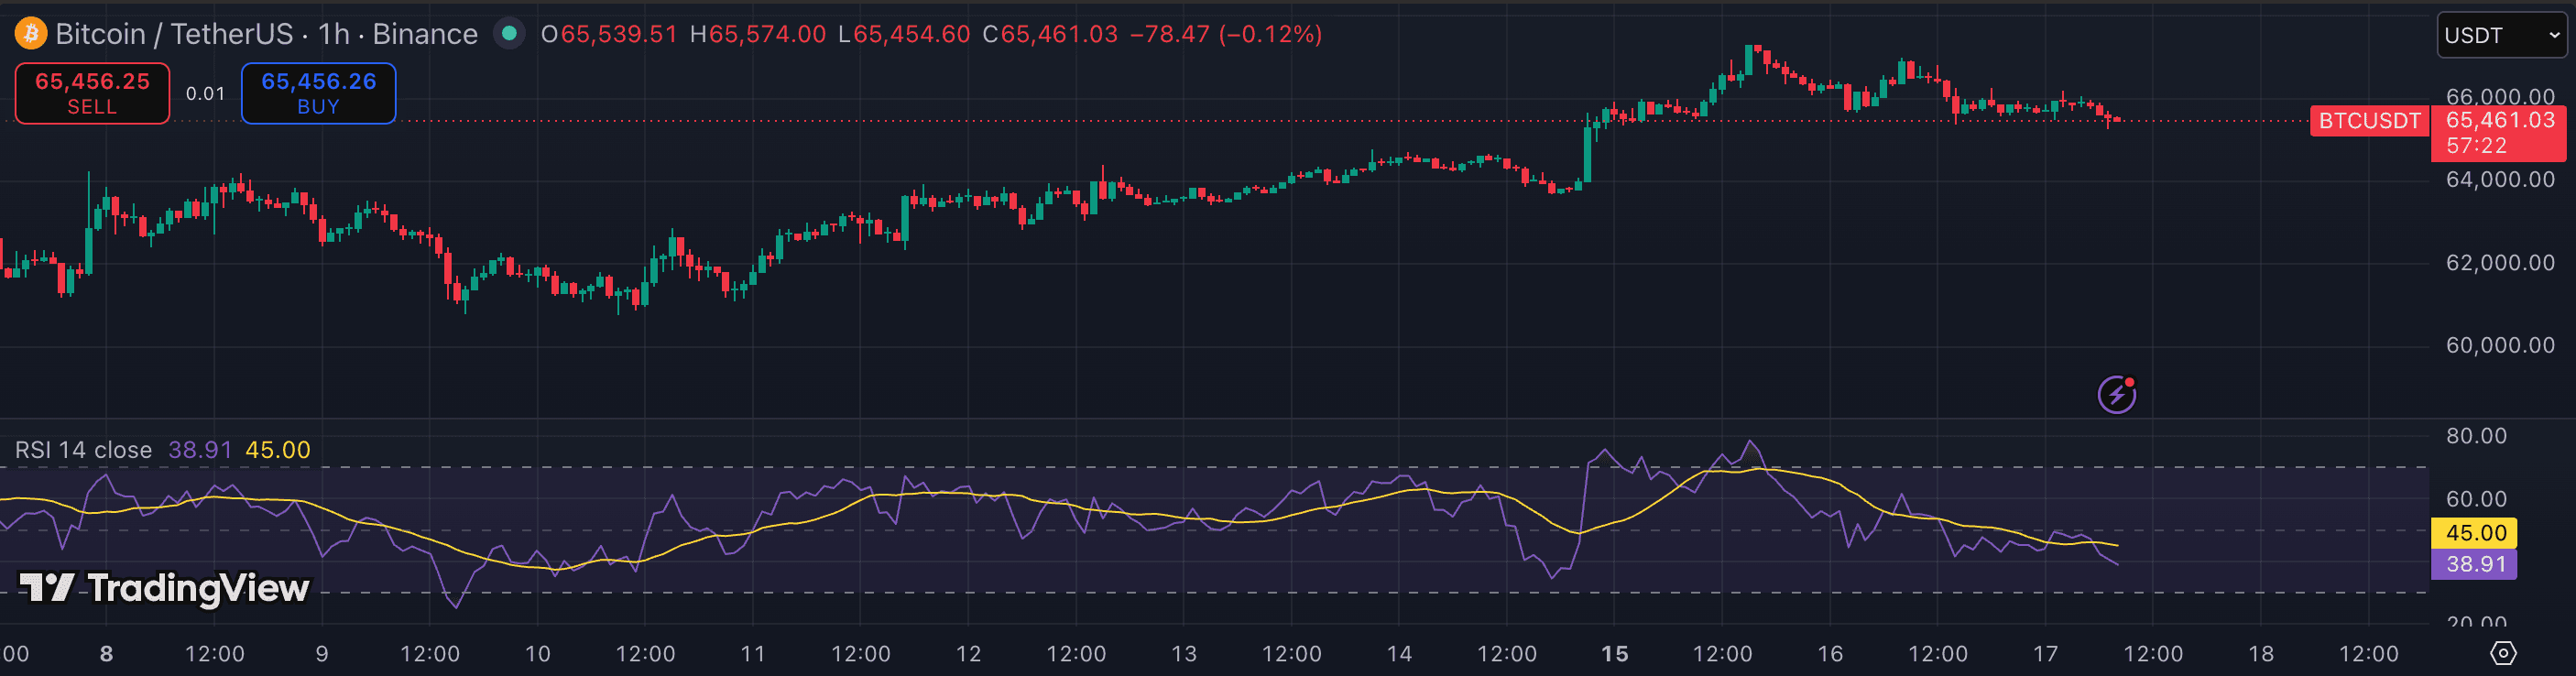
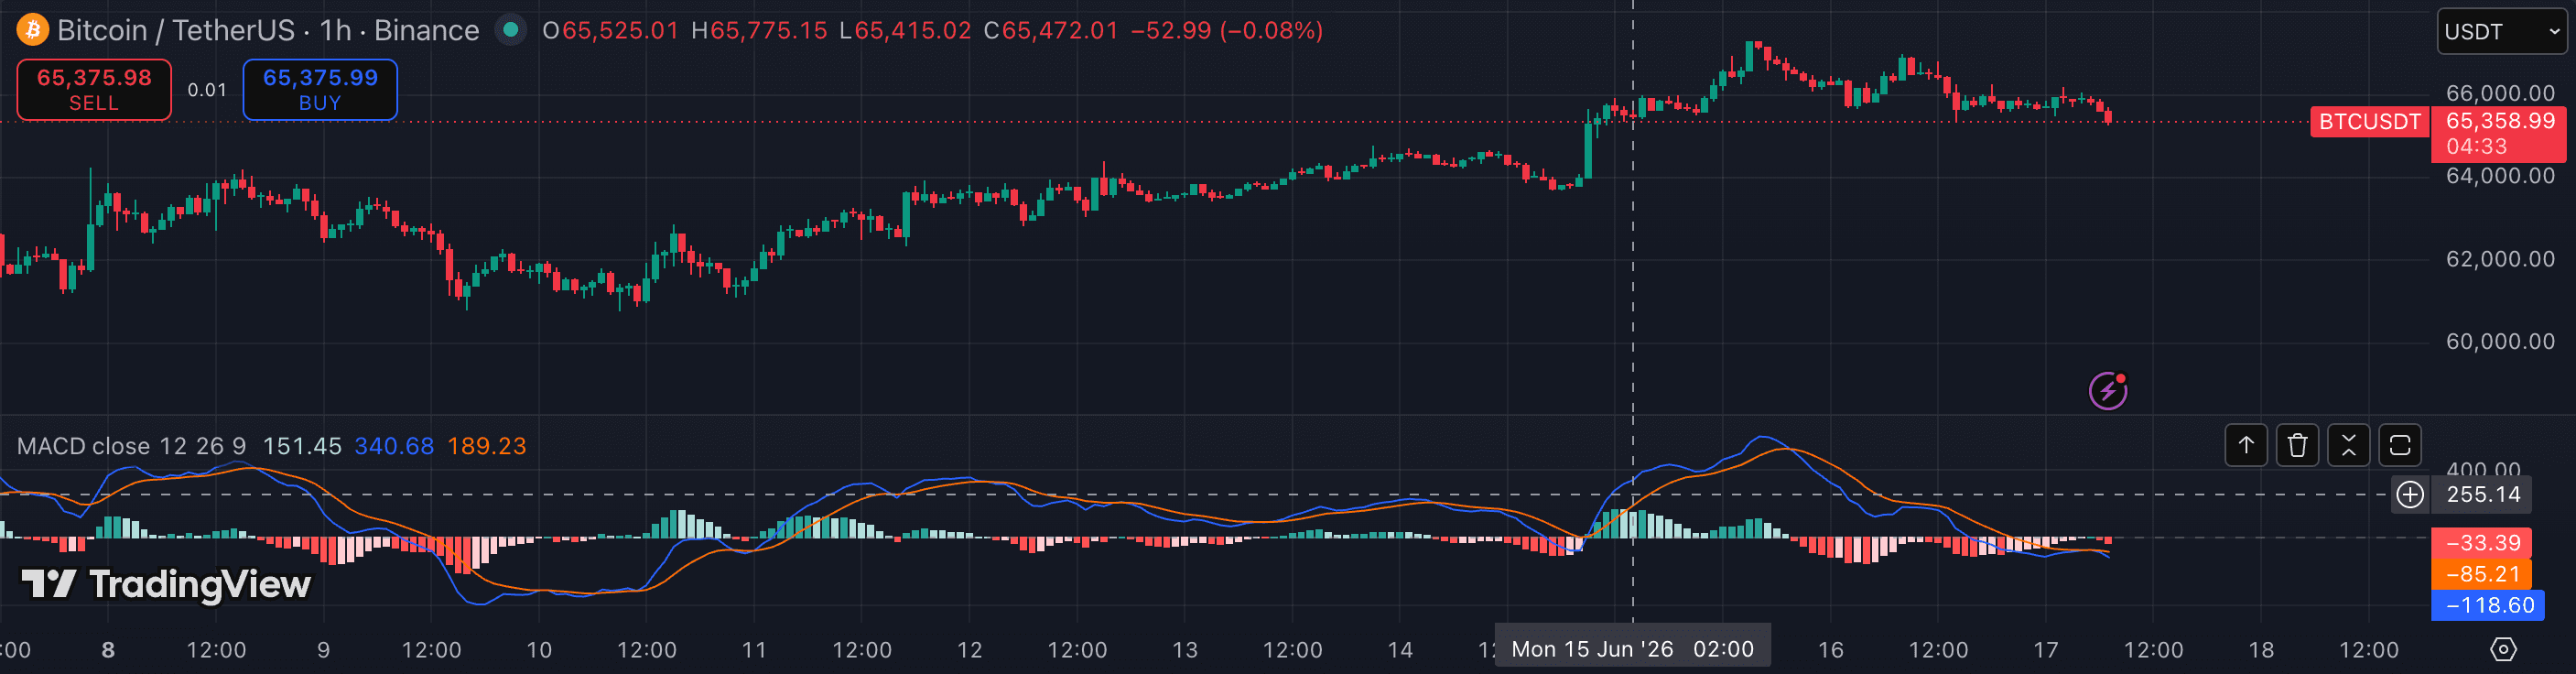
The attributes that matter.
| Attribute | RSI | MACD |
|---|---|---|
| Category | Momentum | Momentum + trend |
| Default settings | Period 14 | 12, 26, 9 |
| Output | Single line, 0–100 | Two lines + histogram |
| Stochastic comparison | Simpler — one read | Richer — histogram + signal line; Stochastic adds a fast %K/%D crossover |
| Best timeframe | 1h · 4h | 1h · 4h · 1D |
| Lag | Medium | Higher than RSI; Stochastic is fastest of the three |
| Divergence quality | ★★★★☆ | ★★★☆☆ |
| Best for | Exhaustion · reversals · divergence | Trend confirmation · momentum shifts |
| Worst in | Strong trends (stays 'overbought') | Tight ranges (whippy histogram) |
Which should you choose?
RSI, MACD, and Stochastic are not interchangeable — they answer different questions. RSI asks: is momentum overextended? MACD asks: is the trend strengthening or weakening? Stochastic asks: where is price relative to its recent range, and are the fast and slow lines crossing? Putting all three on one chart is redundant; understanding what each measures lets you pick the one that fits your strategy.
For crypto swing traders on 1h–4h, the practical split is this: RSI for exhaustion and divergence reads, MACD for trend confirmation and momentum regime, and Stochastic only when you specifically want a fast oscillator for ranging markets or scalping. A clean setup is RSI + MACD together (they do not overlap) — and replace RSI with Stochastic only if your primary strategy is range reversals on 5m–15m charts. Disclaimer: this content is educational only and does not constitute investment advice.
- You want a simple exhaustion and divergence read on 1h–4h
- You trade swing reversals or pullback entries
- You prefer one clean line over multi-line oscillators
- You want to track trend momentum and early regime shifts
- You use the histogram to gauge weakening or strengthening moves
- You trade directional trends rather than counter-trend reversals
Other comparisons
Not investment advice. PineRadar is an editorial directory — links may be affiliate. Always test indicators on a demo account.