Volume ProfilevsOBV
Both Volume Profile and OBV use volume data to explain price behaviour — but they answer completely different questions. Volume Profile maps where volume concentrated in price space; OBV tracks whether volume is flowing in or out over time. Understanding the difference tells you when to reach for each one.
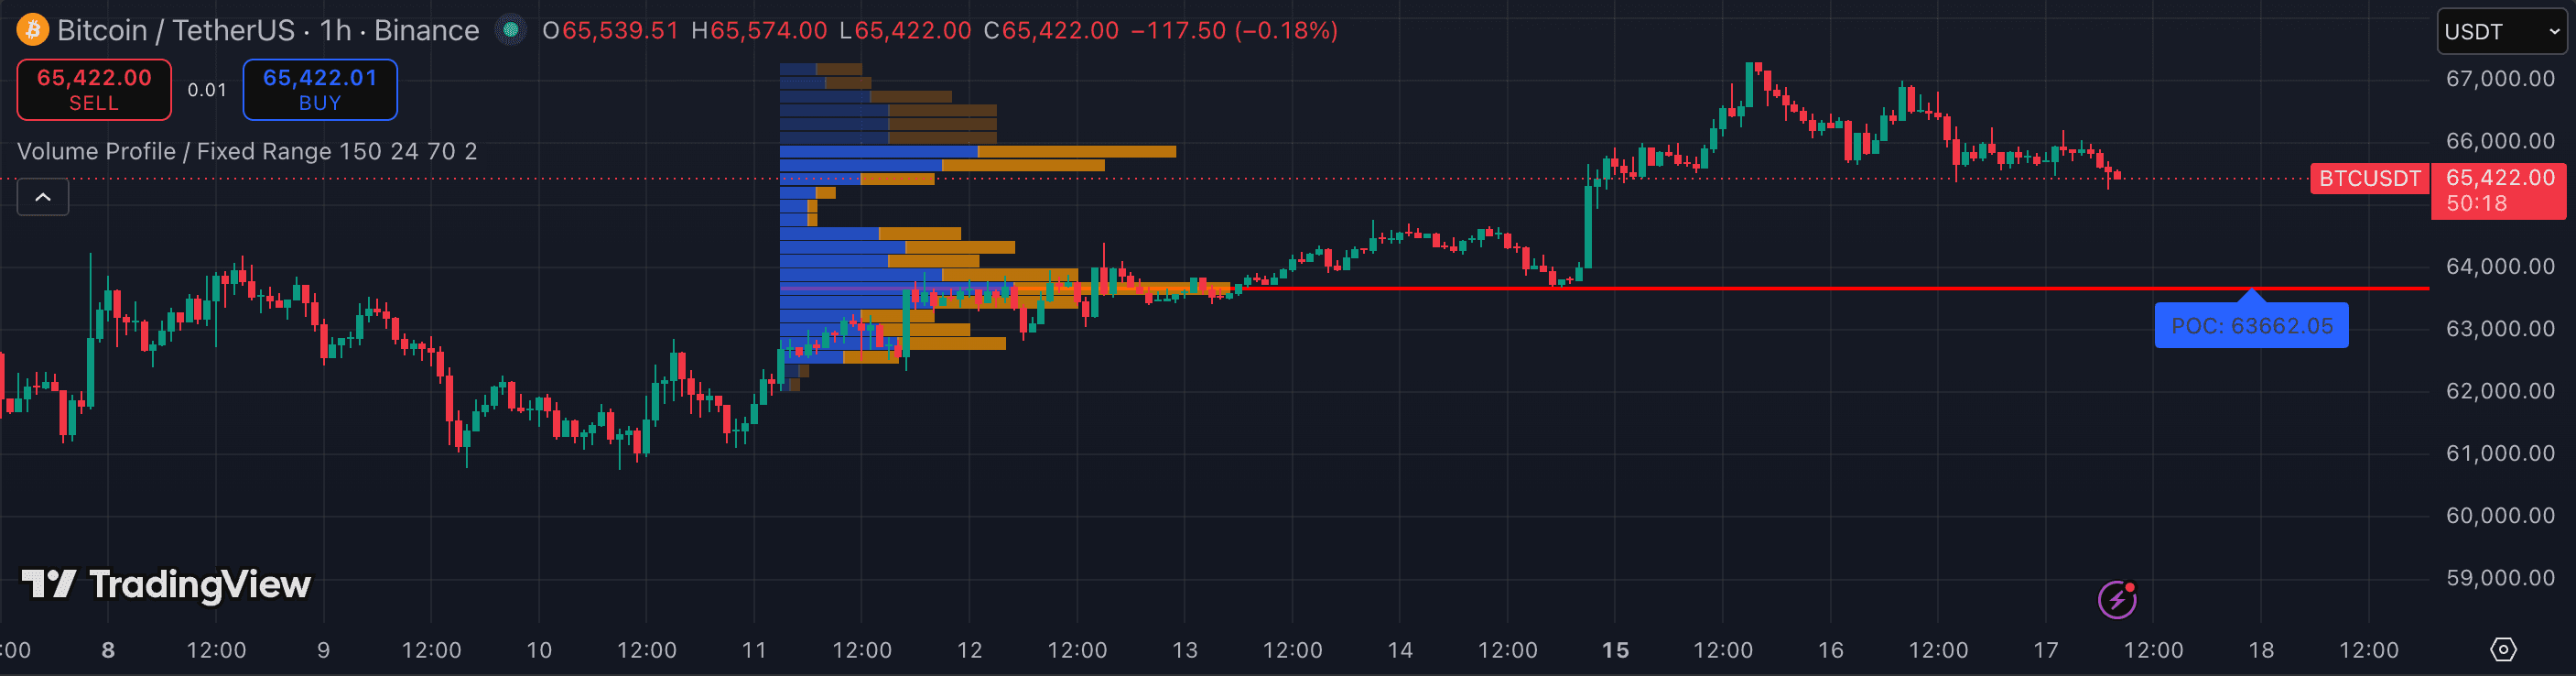
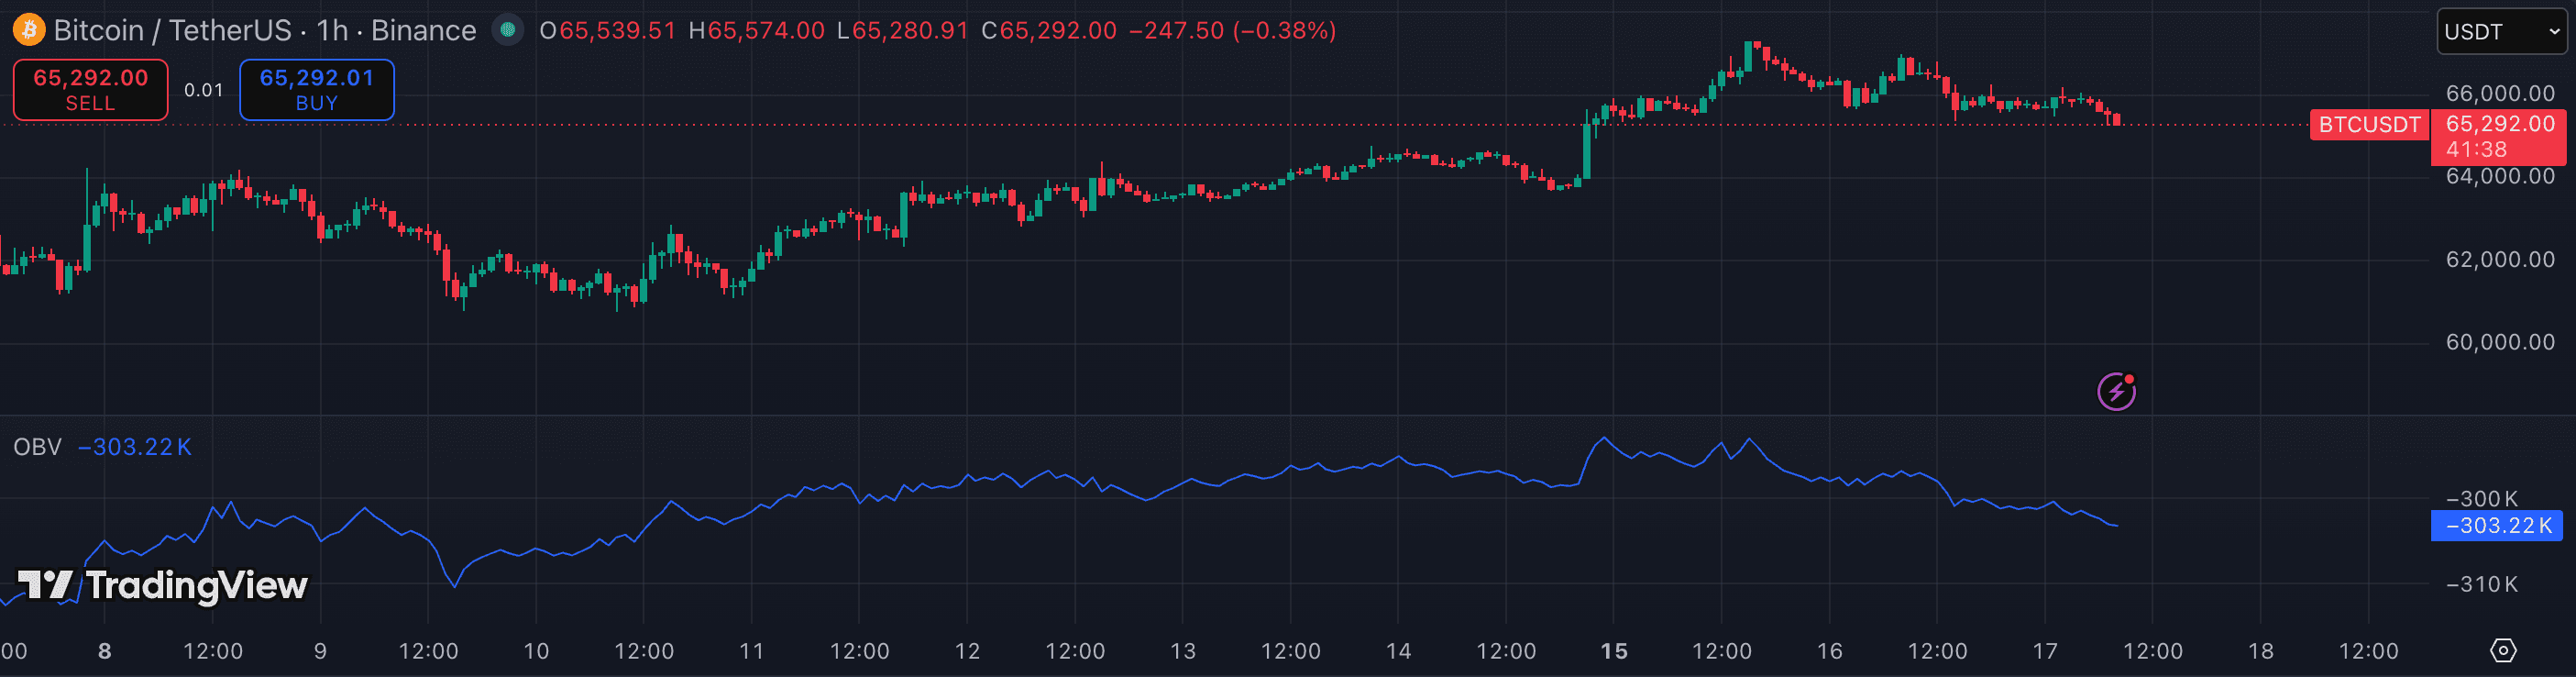
The attributes that matter.
| Attribute | Volume Profile | OBV |
|---|---|---|
| Category | Volume / structure | Volume / momentum |
| Output | Horizontal price histogram | Cumulative running line |
| What it shows | How much volume traded at each price level | Whether cumulative volume flow is up or down |
| Best timeframe | 1h · 4h · 1D (any) | 4h · 1D — higher timeframes smooth noise |
| Leads price? | No — maps past levels | Can lead — volume often shifts before price |
| Best for | S/R mapping, POC targeting, entry location | Breakout confirmation, divergence, trend flow |
| Standalone use | Levels only — needs timing confirmation | Flow only — needs price structure for location |
| Works on low-vol alts | Unreliable — thin books distort node structure | Usable — but noisy on low-cap pairs |
Which should you choose?
Volume Profile and OBV are not alternatives — they address different dimensions of volume. Volume Profile is a spatial tool: it shows where the market has found the most agreement in price terms, revealing the Point of Control (POC), High-Volume Nodes (HVNs), and Low-Volume Nodes (LVNs) that explain why price stalls or accelerates at specific levels. It answers 'where does volume live?' OBV is a flow tool: it accumulates volume directionally over time and answers 'is volume supporting this move or contradicting it?'
The practical combination: use Volume Profile to identify the significant price levels — the POC and HVNs that give you targets and S/R anchors. Use OBV to validate whether the move toward those levels has genuine volume behind it. A rally into an HVN with rising OBV is a higher-quality resistance test than a rally into the same level with OBV diverging — the two tools filter each other and rarely give conflicting reads that would confuse rather than clarify.
- You want to understand why price keeps stalling at a specific level
- You need S/R targets and entry zones defined by volume structure
- You trade swing or position timeframes and need multi-session structural levels
- You want to confirm whether volume is supporting or contradicting a price move
- You look for divergence between price and volume flow on 4h or 1D
- You trade breakouts and need volume confirmation before committing
Other comparisons
Not investment advice. PineRadar is an editorial directory — links may be affiliate. Always test indicators on a demo account.