MACDvsBollinger Bands
MACD reads momentum through moving average divergence. Bollinger Bands read volatility through standard deviation. They measure different things — yet many traders reach for both at once. Here's when each one earns its pane and when they're genuinely complementary.
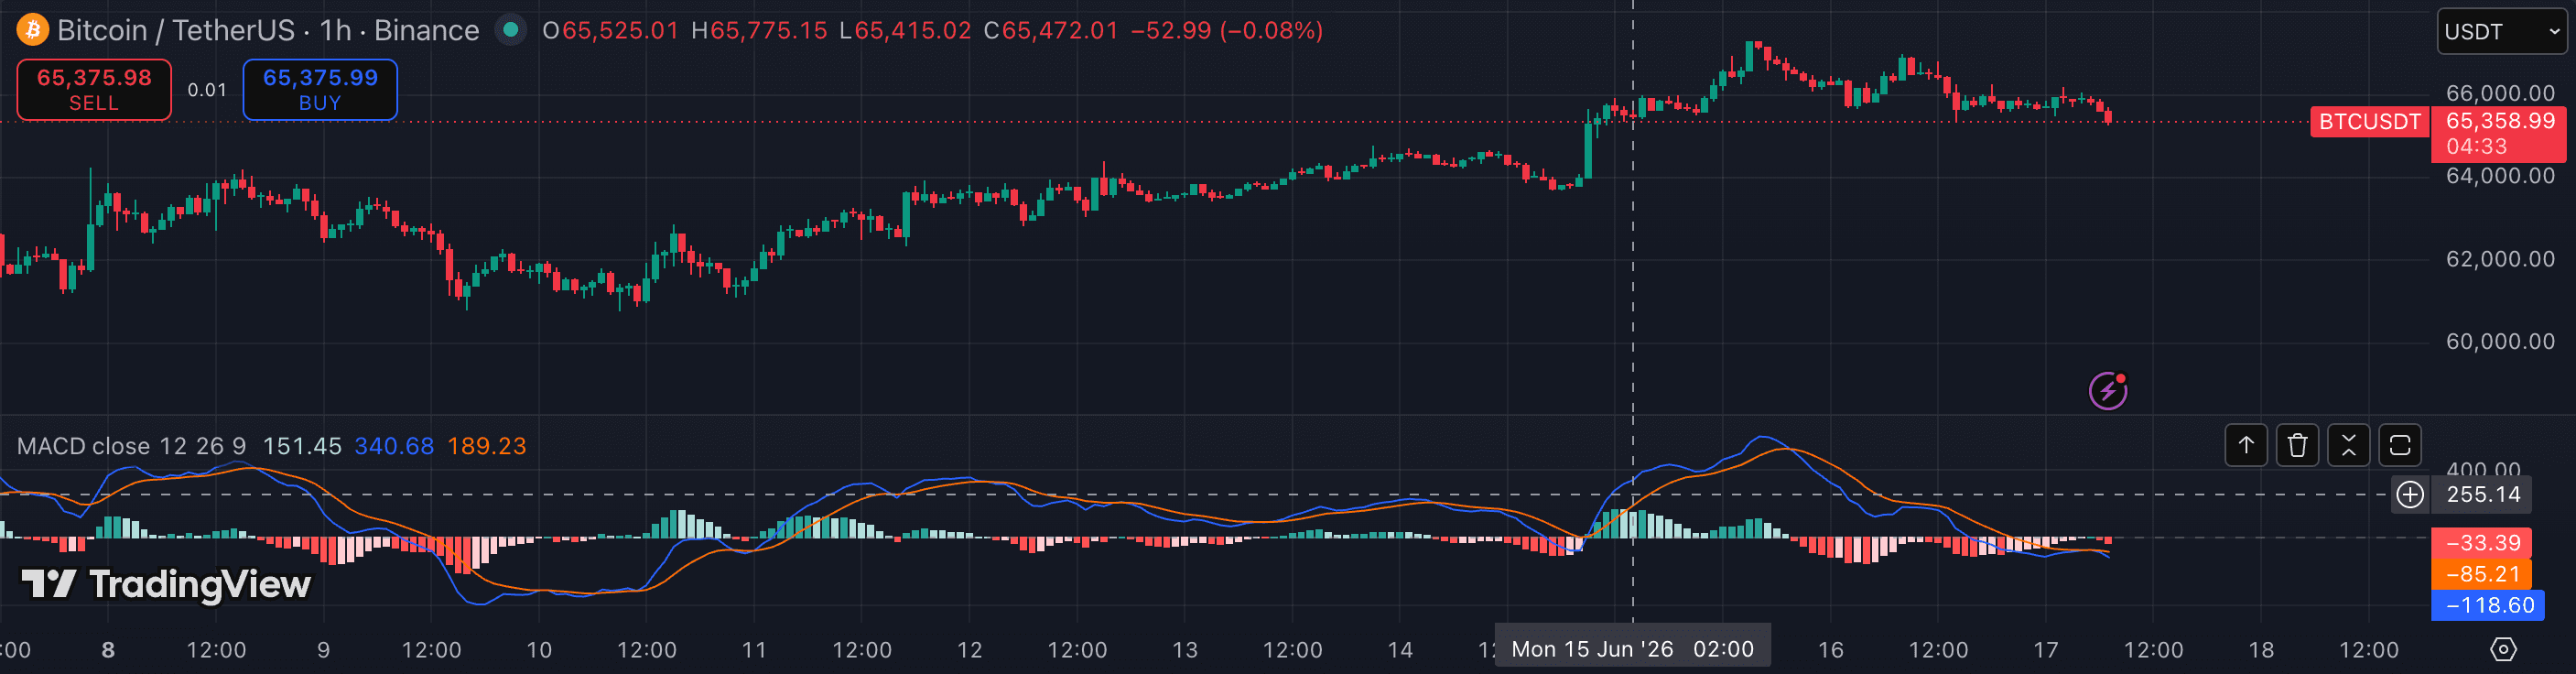
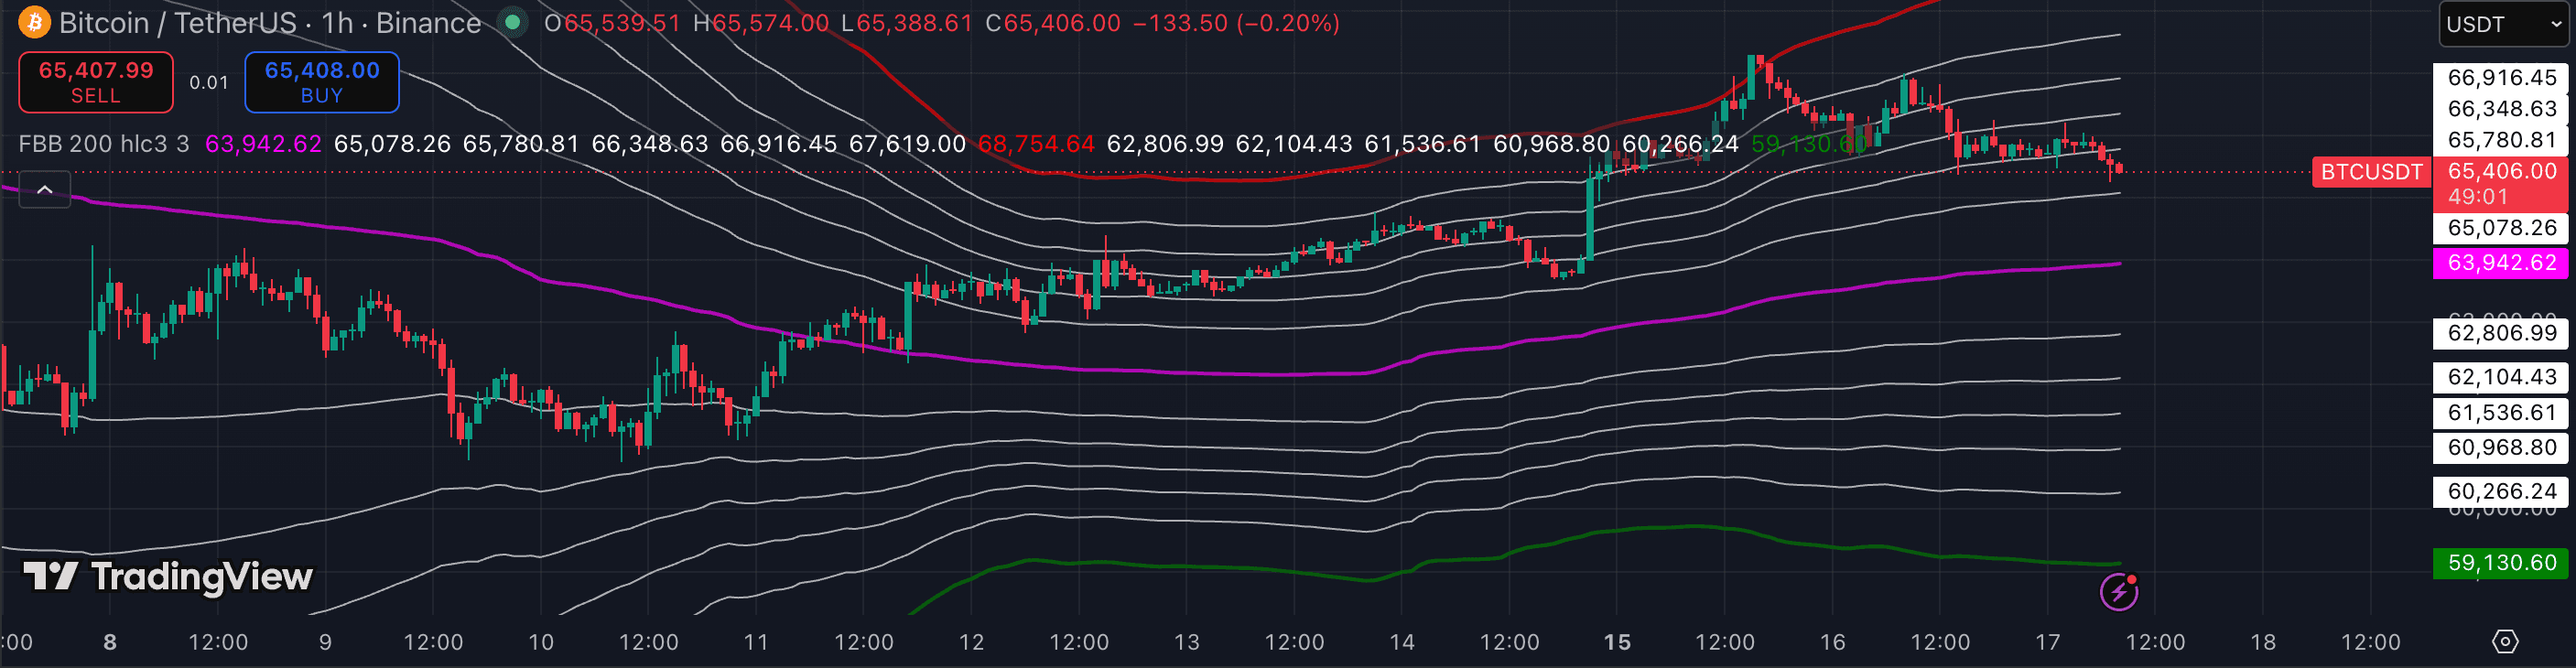
The attributes that matter.
| Attribute | MACD | Bollinger Bands |
|---|---|---|
| Category | Momentum + trend | Volatility |
| Output | Two lines + histogram | Upper / middle / lower bands |
| Calculation basis | EMA crossover (12/26/9) | 20-period SMA ± 2 std dev |
| Tells you | Trend direction + momentum shift | Volatility regime + S/R zones |
| Directional? | Yes — above/below zero and histogram direction | No — bands expand and contract symmetrically |
| Best timeframe | 1h · 4h · 1D | 15m · 1h · 4h · 1D |
| Worst in | Sideways ranges (constant false crosses) | Strong trends (outer band tag ≠ reversal) |
| Entry trigger? | Yes — zero-line cross, histogram flip | No — signals context, not a direct trigger |
Which should you choose?
MACD and Bollinger Bands answer different questions about the same market. MACD tells you whether momentum is building or fading: a rising histogram signals accelerating force behind a move; a falling histogram warns the move is losing steam. The zero line tells you trend bias. Bollinger Bands tell you whether the market is compressed or expanded: narrow bands mean a breakout is loading; wide bands mean volatility is extended and mean-reversion is more probable.
The practical combination: use Bollinger Bands to identify the volatility regime first. In a squeeze (narrow bands), look to MACD's zero-line position and histogram direction for the breakout lean. In a wide-band, trending environment, use MACD's histogram acceleration to time entries and exits rather than fading the outer band. Together they form a volatility context (BB) plus momentum confirmation (MACD) stack — more informative than either alone.
- You trade trends on 1h or above and need momentum confirmation
- You want early warning when a move is fading via the histogram
- You need a clear zero-line bias filter for your trade direction
- You trade range-bound markets or squeeze breakouts
- You need a visual volatility read and dynamic S/R levels
- You use squeeze setups and want the BB component as the primary signal
Other comparisons
Not investment advice. PineRadar is an editorial directory — links may be affiliate. Always test indicators on a demo account.