OBVvsCVD
OBV and CVD both use volume to track who is in control of a market — but they do it very differently. OBV is four decades old and ships with every charting platform. CVD is order-flow derived and requires tick-level data. Here's when each one gives you the edge.
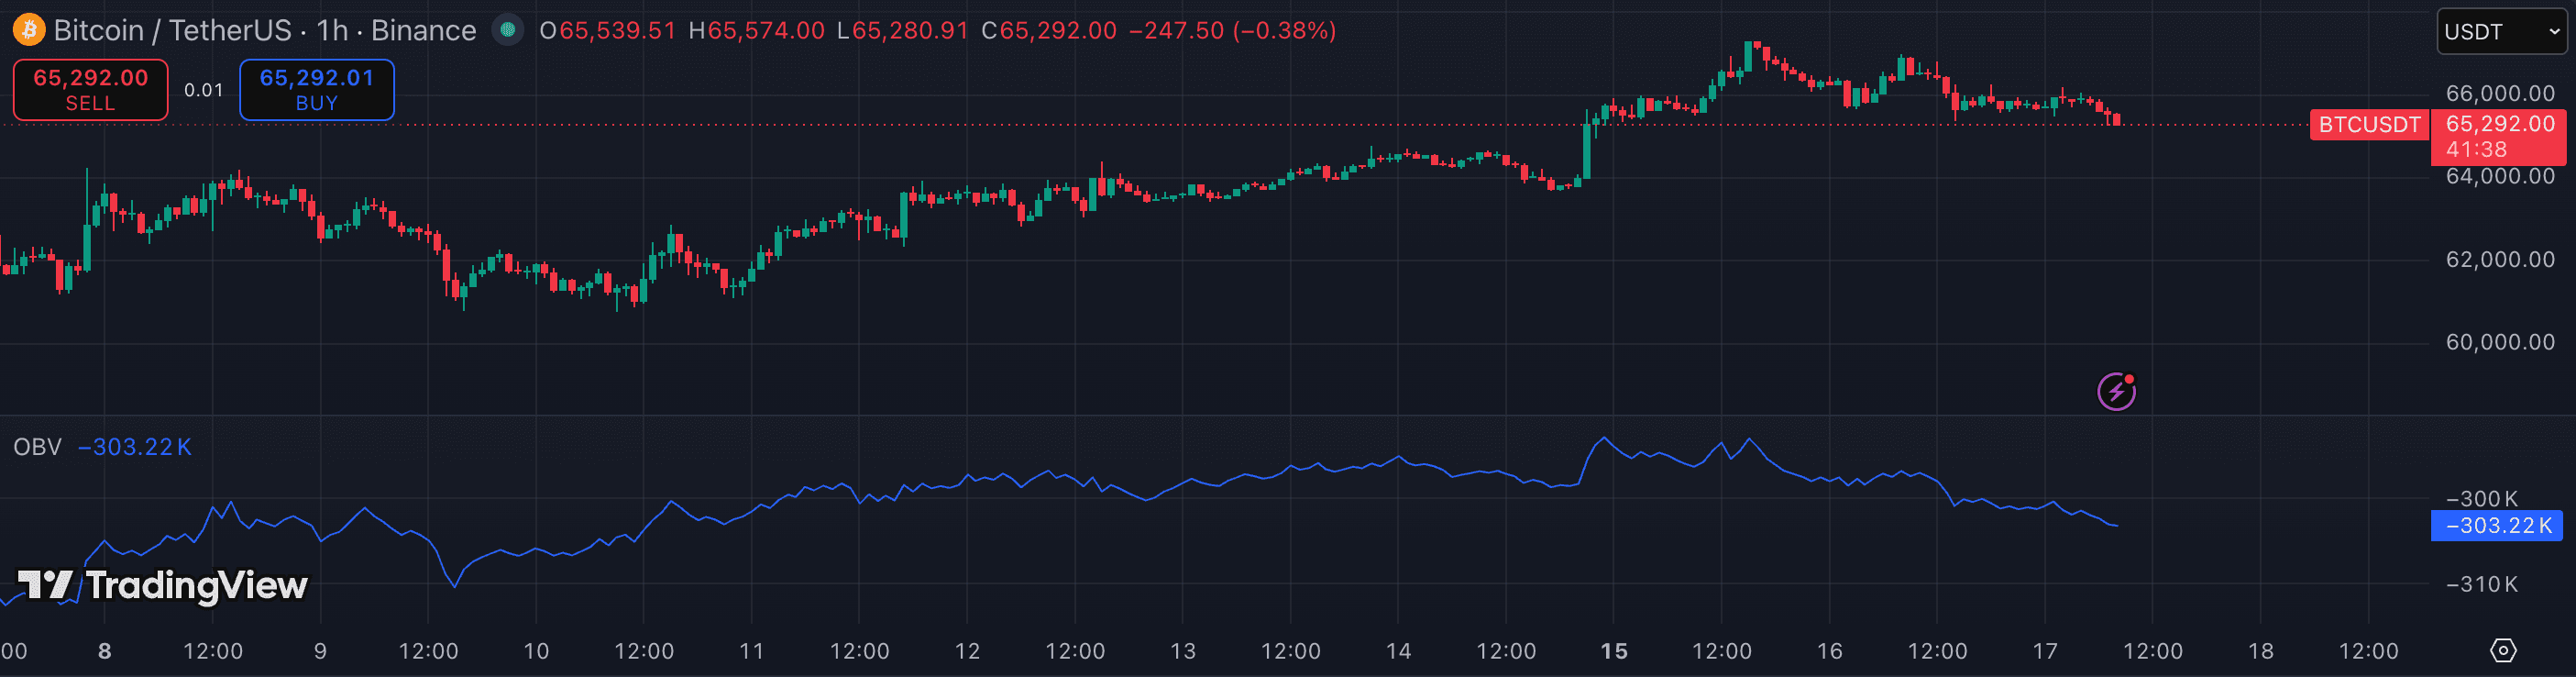
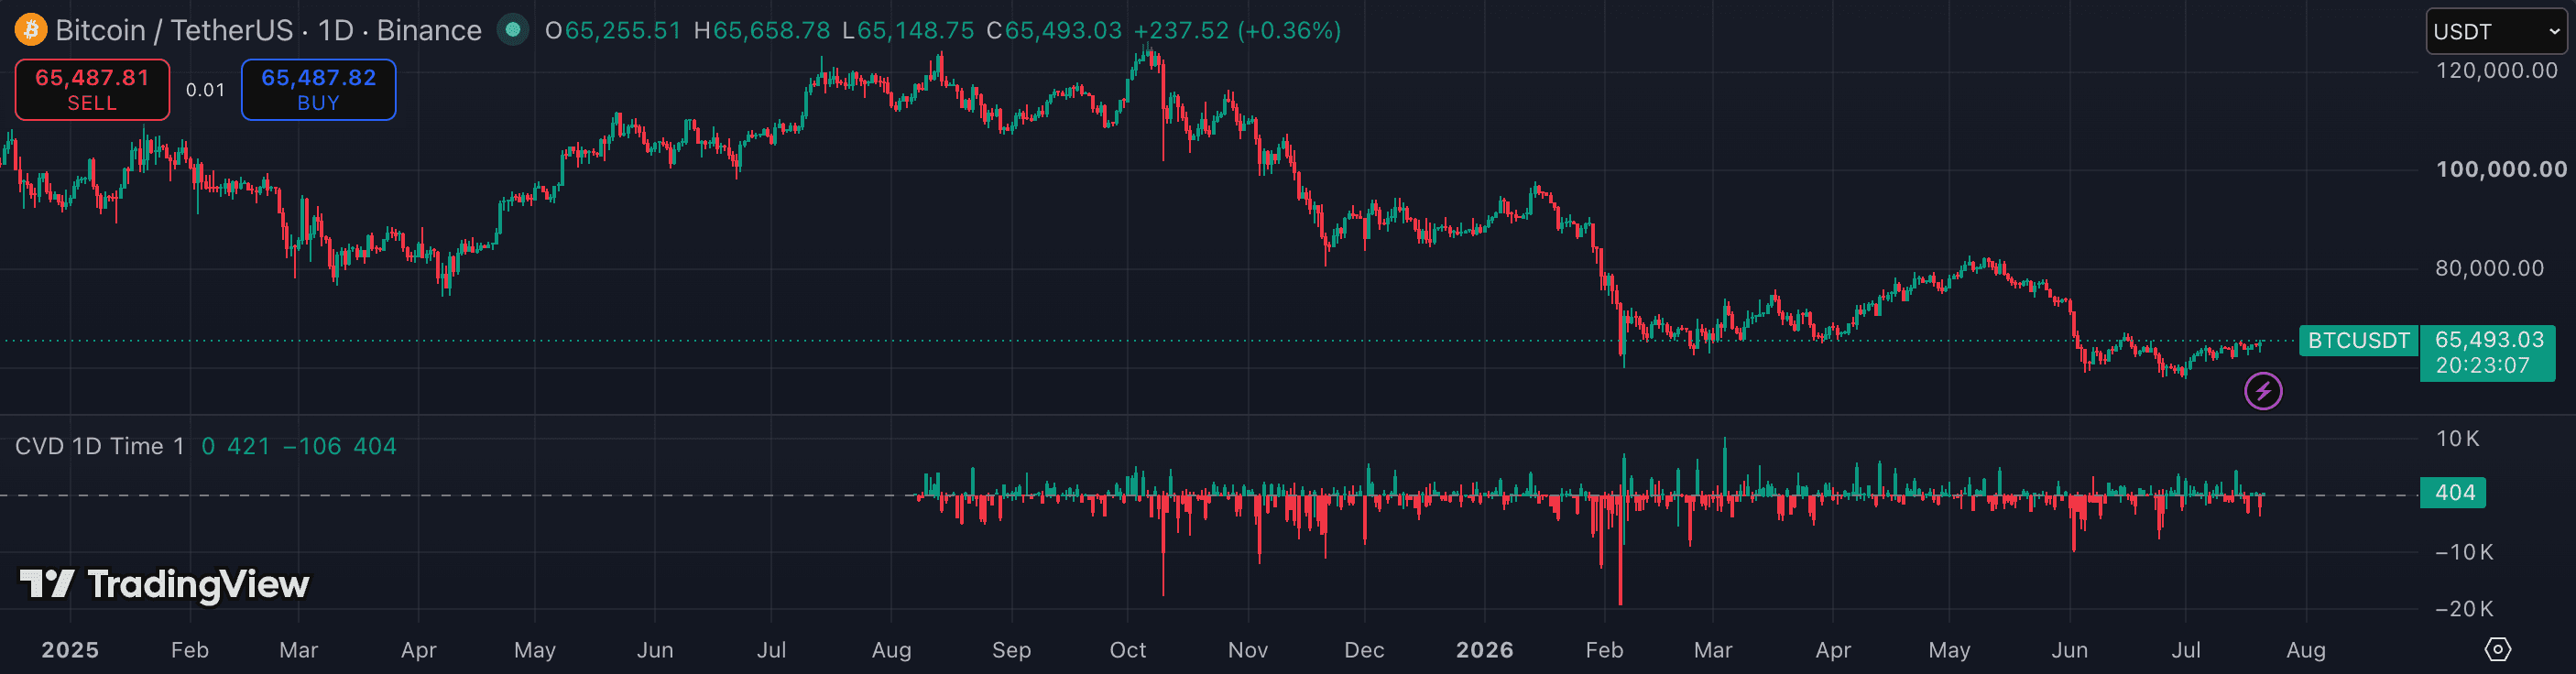
The attributes that matter.
| Attribute | OBV | CVD |
|---|---|---|
| Category | Volume / momentum | Order flow / volume delta |
| Calculation | Cumulative ± close volume | Cumulative (buy vol − sell vol) per bar |
| Data needed | OHLCV (basic) | Tick-level bid/ask volume |
| Output | Single cumulative line | Single cumulative delta line |
| Availability | All TradingView plans, built-in | Community scripts; premium plans may vary |
| Best for | Trend confirmation & divergence | Intraday order-flow analysis & fakeout detection |
| Best timeframe | 1h · 4h · 1D | 1m · 5m · 15m · 1h |
| Works on low-vol alts | Usable — but noisy | Unreliable — thin books distort delta |
Which should you choose?
OBV answers 'is volume flowing into or out of this asset over time?' It treats every up-close candle as buying and every down-close candle as selling — a simplification, but one that works well for swing and position timeframes where you want confirmation that a trend has real participation behind it. Its divergence signals (price higher high, OBV lower high) are a classic early-warning tool that holds up across crypto and traditional markets.
CVD answers 'who is actually lifting the ask versus hitting the bid, right now?' It uses tick-level aggressor data, so it captures real-time order-flow pressure rather than inferring it from close direction. That makes it far more precise for intraday traders watching for absorption zones or fakeout divergences — but it requires better data and loses reliability on thinly traded pairs.
The practical rule: use OBV for higher-timeframe trend confirmation on any liquid pair. Switch to CVD when you trade intraday on BTC, ETH, or SOL and need to read whether a price move is driven by real aggressive buying or is just floating on passive flow.
- You swing trade or position trade on 1h+
- You want a free, built-in volume confirmation tool
- You trade altcoins where tick data is unreliable
- You trade BTC/ETH/SOL intraday on 5m–1h
- You want to detect absorption and fakeouts before price confirms
- You already use a DOM or footprint chart and want a complementary line indicator
Other comparisons
Not investment advice. PineRadar is an editorial directory — links may be affiliate. Always test indicators on a demo account.