RSIvsBollinger Bands
An oscillator against a volatility envelope — two of the most widely-used indicators that actually measure completely different things. Most traders who pit them against each other are solving the wrong problem. Here's which one to reach for and when.
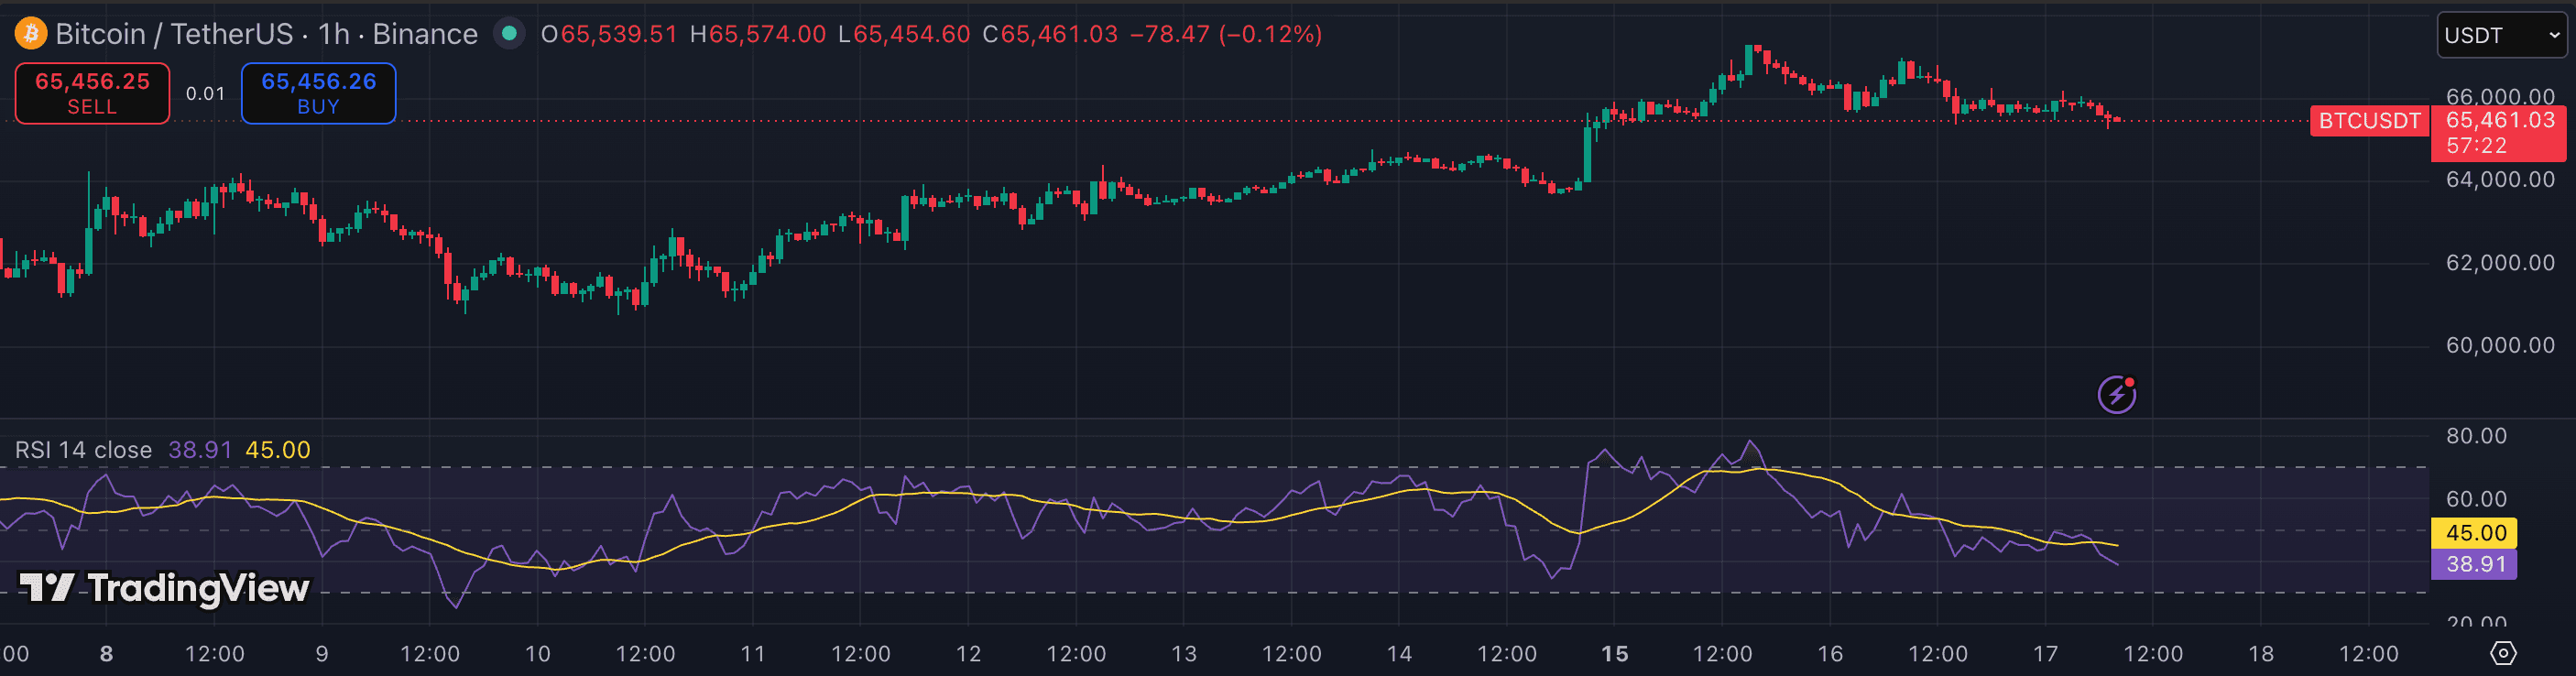
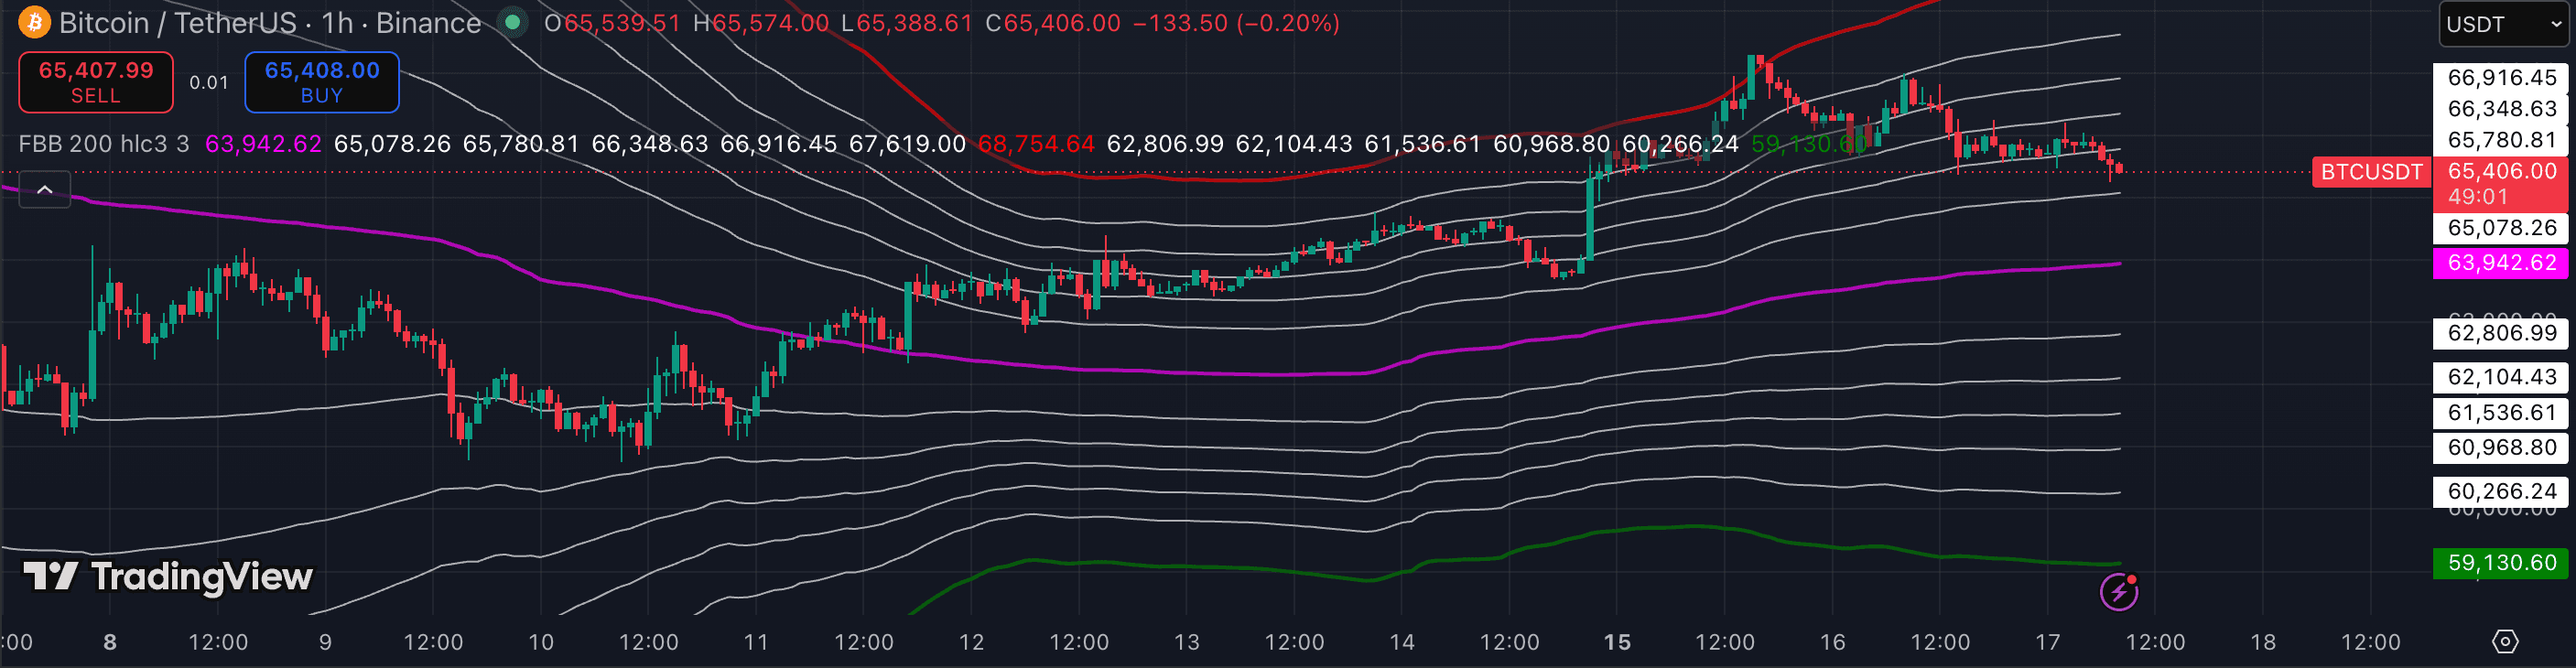
The attributes that matter.
| Attribute | RSI | Bollinger Bands |
|---|---|---|
| Category | Momentum | Volatility |
| What it measures | Speed of price change (0–100) | Volatility expansion/contraction |
| Output | Single oscillator line | Three bands overlaid on price |
| Best timeframe | 1h · 4h | 1h · 4h · 1D |
| Works in trends | Divergence only — signals lag | Trend rides upper/lower band |
| Works in ranges | OB/OS signals most reliable | Band-to-band mean reversion |
| Volatility awareness | None — same thresholds in all markets | Built-in — bands widen/narrow automatically |
| Best for | Exhaustion / divergence reads | Squeeze breakouts · volatility regimes |
| Worst in | Strong trends (stays 'overbought') | Directionless ranging (no edge alone) |
Which should you choose?
RSI and Bollinger Bands are not competitors — they answer different questions. RSI tells you how fast price is moving and whether momentum is exhausted or diverging. Bollinger Bands tell you how volatile the market is and whether price is stretched relative to its own average. You can't swap one for the other because they don't overlap in what they measure.
The correct framing: use Bollinger Bands for the regime read (are we in a squeeze? is the market expanding or compressing?) and RSI for the exhaustion and divergence read (is momentum fading at this band touch?). A Bollinger Band tag with RSI confirming the same state — lower band touch plus RSI oversold in a range — is a higher-quality signal than either alone. On crypto, this combination is one of the more reliable mean-reversion setups in ranging markets.
- You want to spot exhaustion and momentum divergence
- You trade swing reversals on 1h or 4h
- You want a simple one-number momentum read
- You trade squeeze breakouts and volatility compressions
- You want a visual band structure showing mean and deviation
- You trade trend continuation by riding the upper or lower band
Other comparisons
Not investment advice. PineRadar is an editorial directory — links may be affiliate. Always test indicators on a demo account.