Volume ProfilevsCVD
Volume Profile and CVD both use volume, but one maps where volume happened and the other tracks who was more aggressive as it happened. Volume Profile is a structural level tool; CVD is an order-flow pressure tool. This comparison separates location from participation so traders can decide which question they are actually asking. Educational content only; not financial advice.
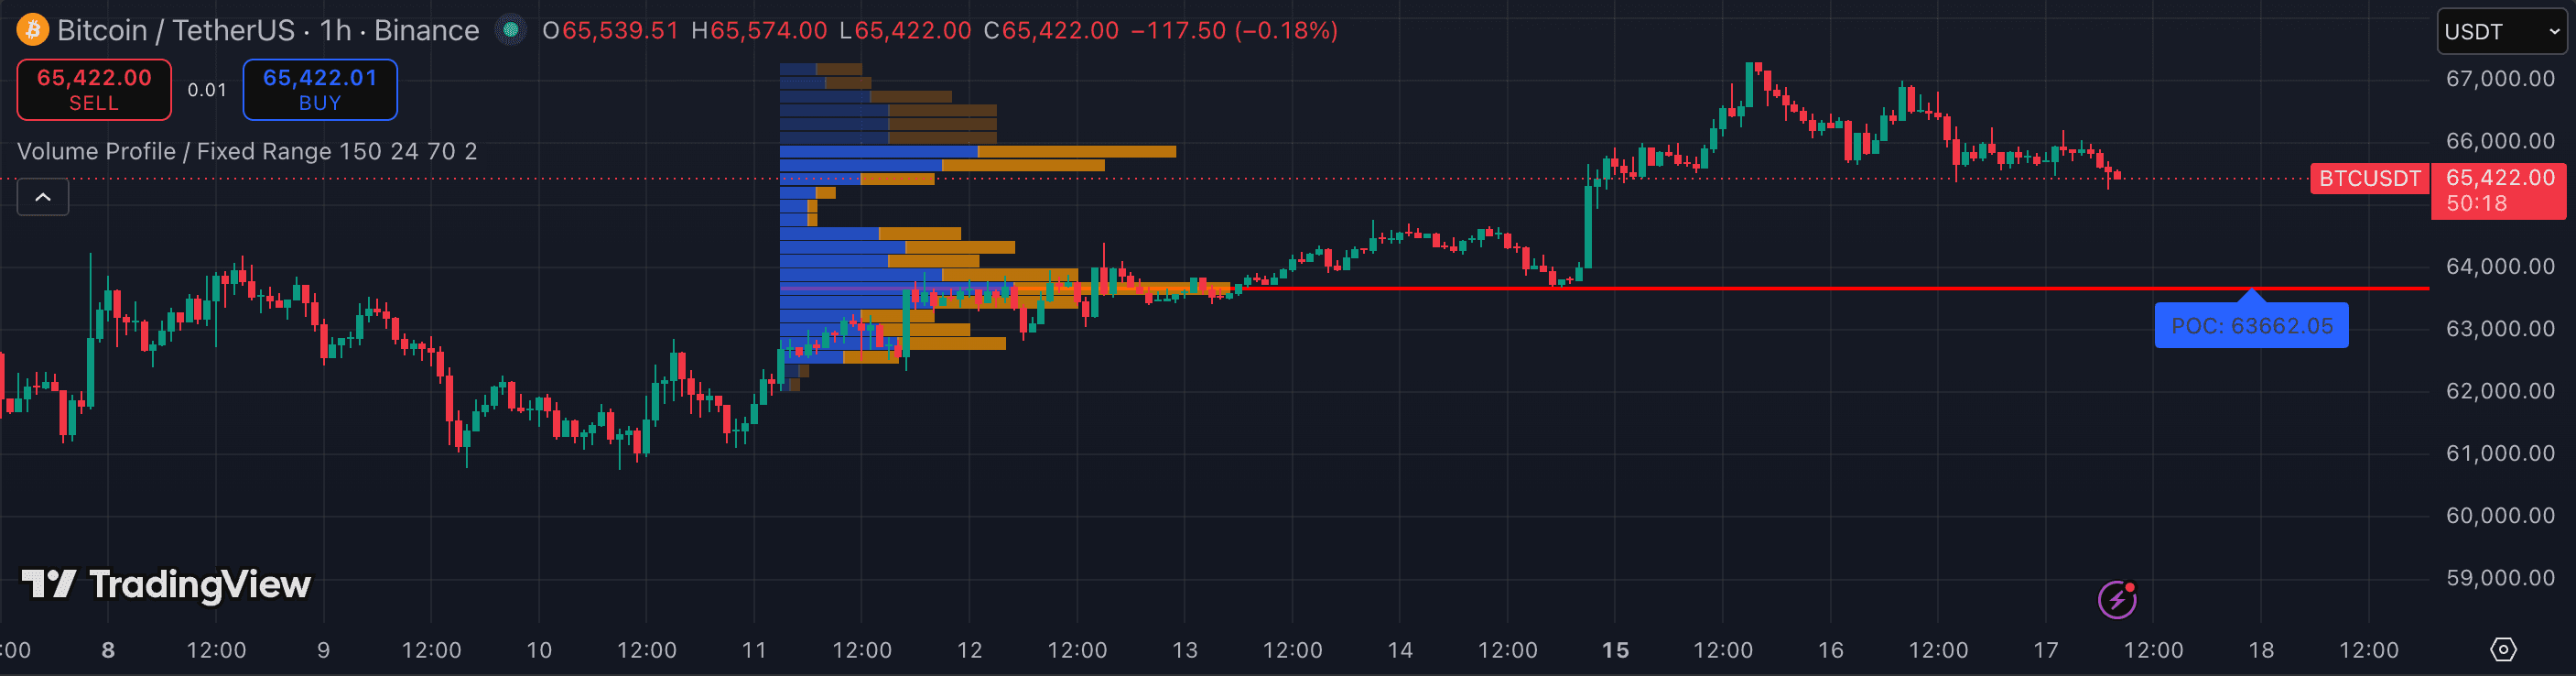
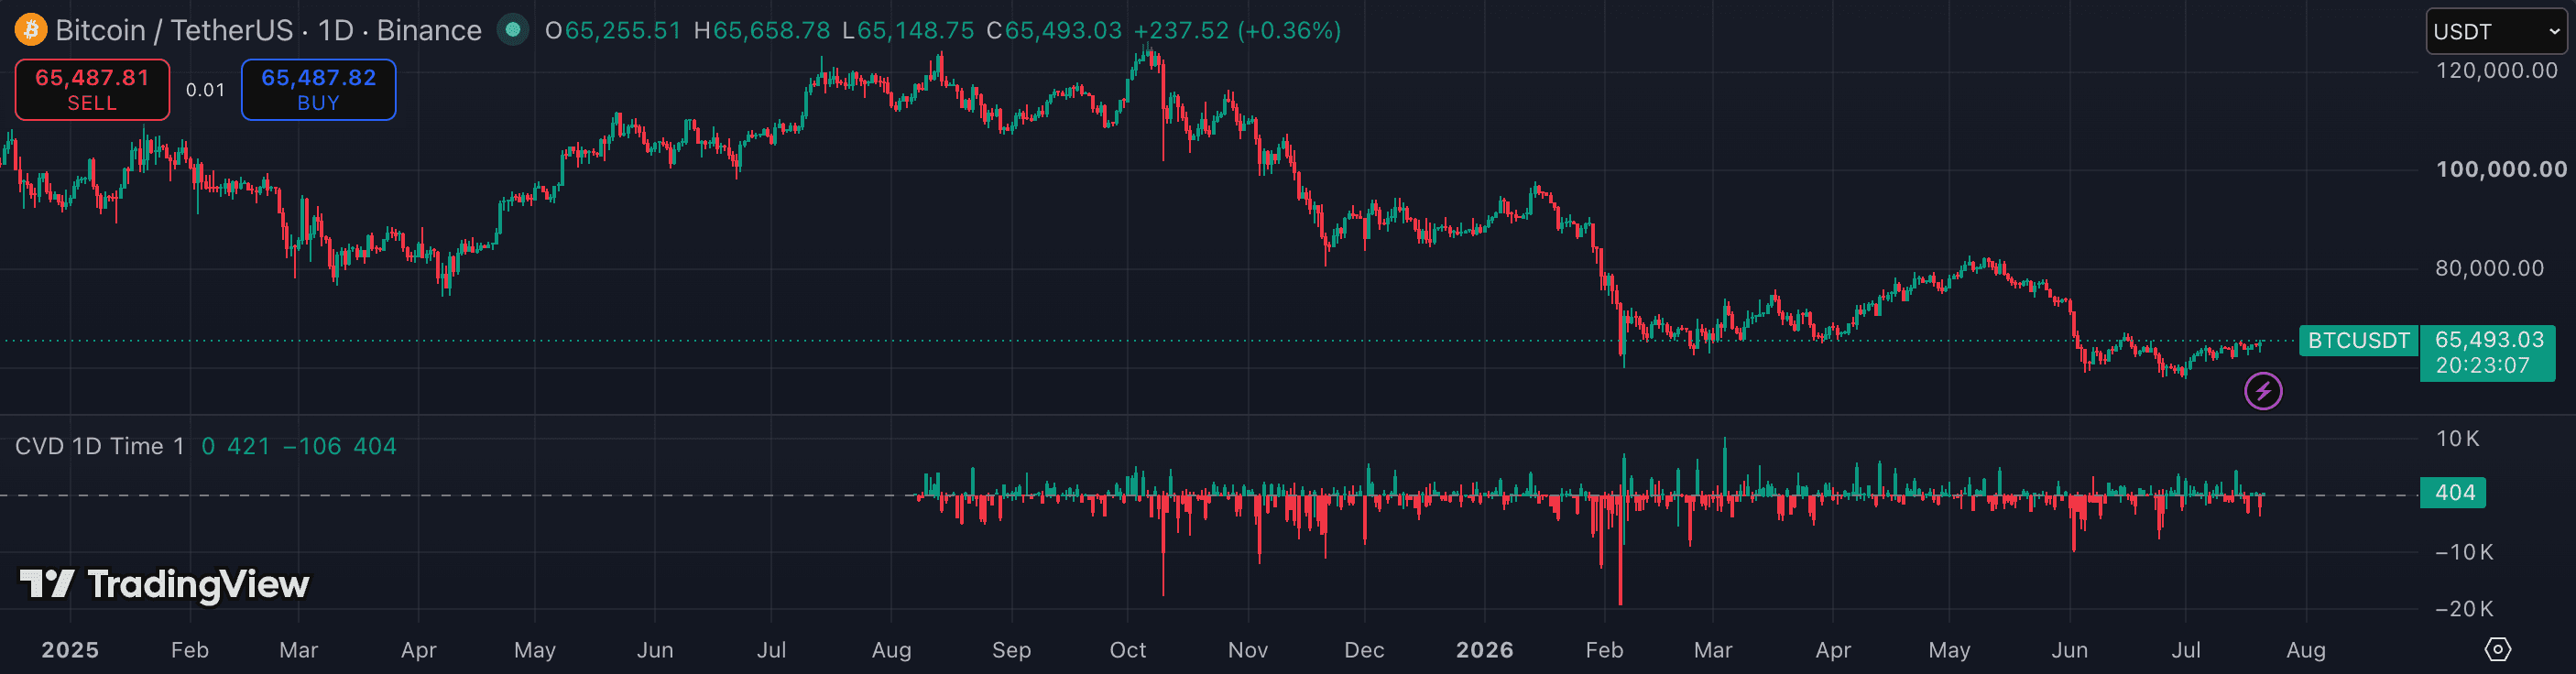
The attributes that matter.
| Attribute | Volume Profile | CVD |
|---|---|---|
| Category | Volume / structure | Volume / order flow |
| Measures | Volume traded at each price level | Cumulative buy-volume minus sell-volume pressure |
| Output | Horizontal profile with POC, HVNs, LVNs | Cumulative delta line or histogram |
| Best timeframe | 15m · 1h · 4h · 1D | 1m · 5m · 15m · 1h |
| Best for | Finding significant levels and value areas | Reading absorption and participation quality |
| Data sensitivity | Needs reliable volume history | Needs reliable delta or tick-style data |
| Standalone risk | Levels without timing | Flow without location |
| Typical pairing | Momentum or price-action trigger | VWAP, structure, or profile level |
Which should you choose?
Volume Profile answers the location question: where has the market actually transacted? Its Point of Control, high-volume nodes, and low-volume nodes explain why price often slows, accepts, or moves quickly through specific areas. For traders building a map of support, resistance, and value, it is the more complete starting point.
CVD answers the participation question: are aggressive buyers or sellers driving the move right now? Rising price with flat or falling CVD can flag absorption; falling price with stronger CVD can warn that selling pressure is fading. That information is valuable, but it still needs a price level to make sense — CVD alone does not tell you where the reaction should matter.
The practical stack is sequential: use Volume Profile to mark the level, then use CVD to judge whether the reaction at that level is supported by real order-flow pressure. If only one tool fits the chart, Volume Profile is usually the better first choice for structural analysis; CVD is the sharper add-on for liquid intraday markets where delta data is trustworthy.
- You need a map of POC, HVN, and LVN levels before analysing a setup
- You trade 1h–1D charts where structural levels matter more than tape speed
- You want price-location context that can be combined with many trigger tools
- You trade liquid crypto intraday and need to read participation quality
- You watch for absorption or divergence between price and aggressive volume
- You already have a key level and want to know how flow behaves there
Other comparisons
Not investment advice. PineRadar is an editorial directory — links may be affiliate. Always test indicators on a demo account.