RSIvsStochastic RSIvsWaveTrend Oscillator
Three momentum oscillators that every crypto trader eventually compares: RSI, Stochastic RSI, and WaveTrend. They all measure momentum, but they do it differently enough that choosing wrongly means getting the right signal at the wrong time — or missing it entirely. This comparison covers what each one actually measures, where each excels, and how to combine them when using two at once is smarter than picking one. Educational content only; not financial advice.
RSI
momentumBuilt-in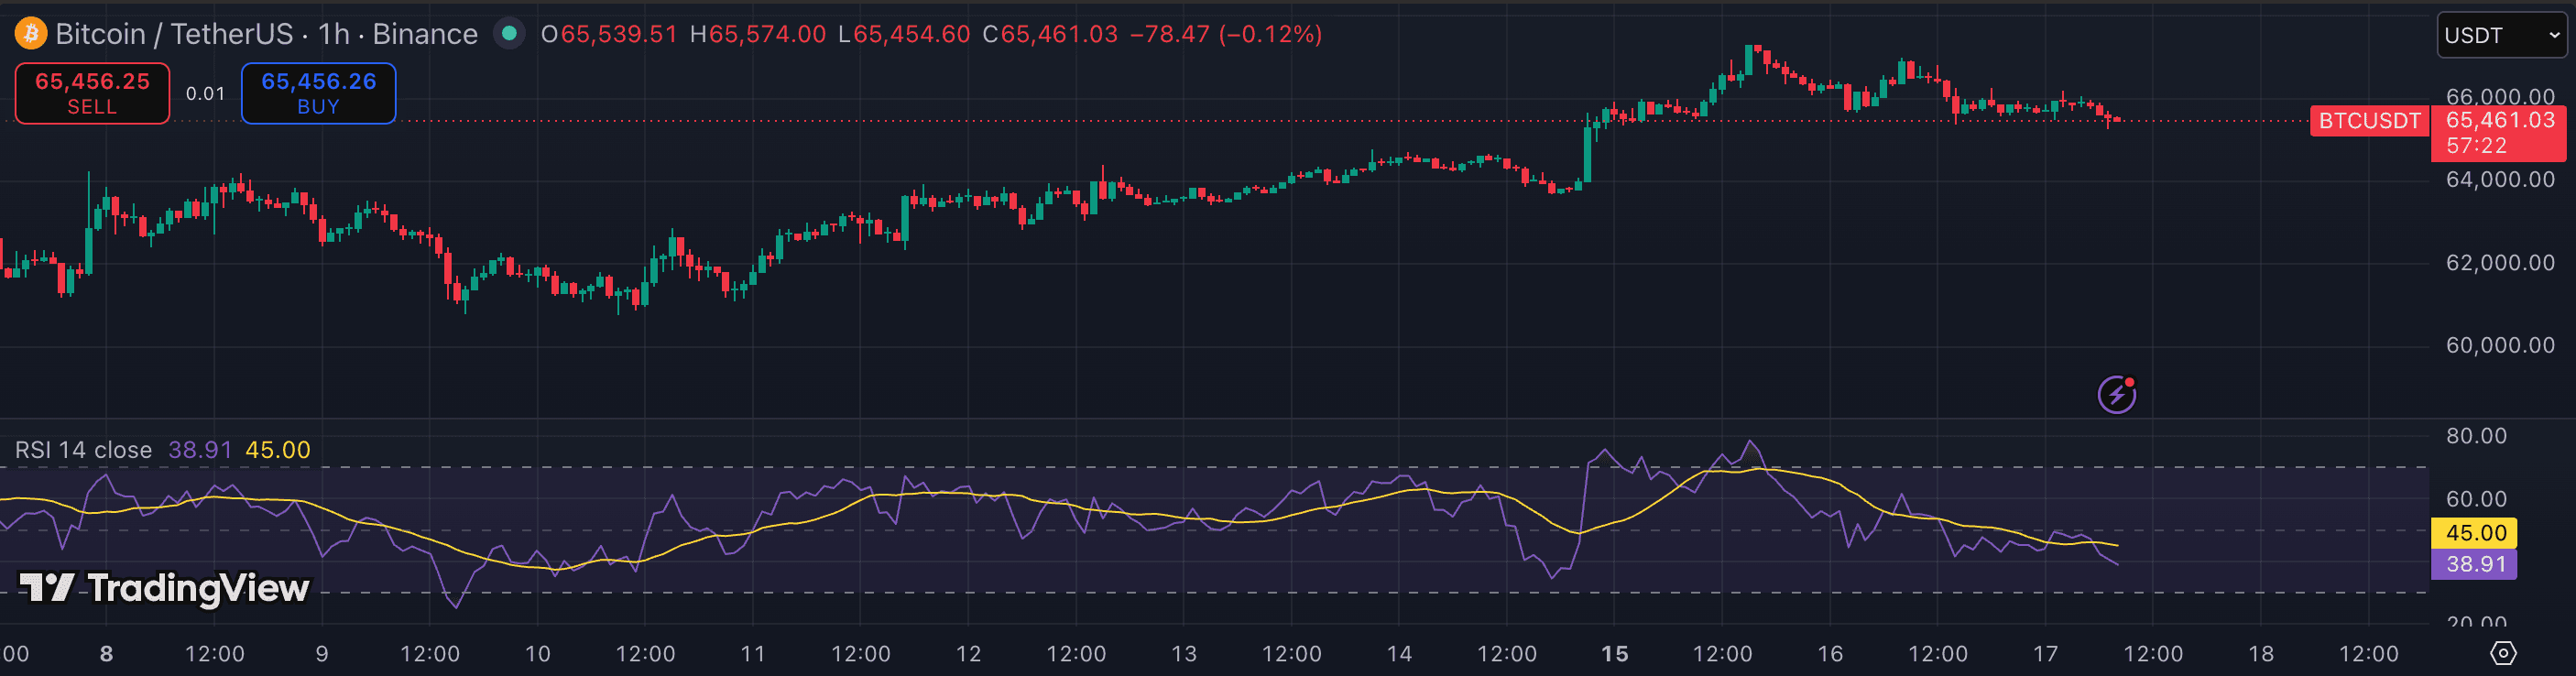
The classic 14-period oscillator. Overbought/oversold + divergence.
Stochastic RSI
momentumBuilt-in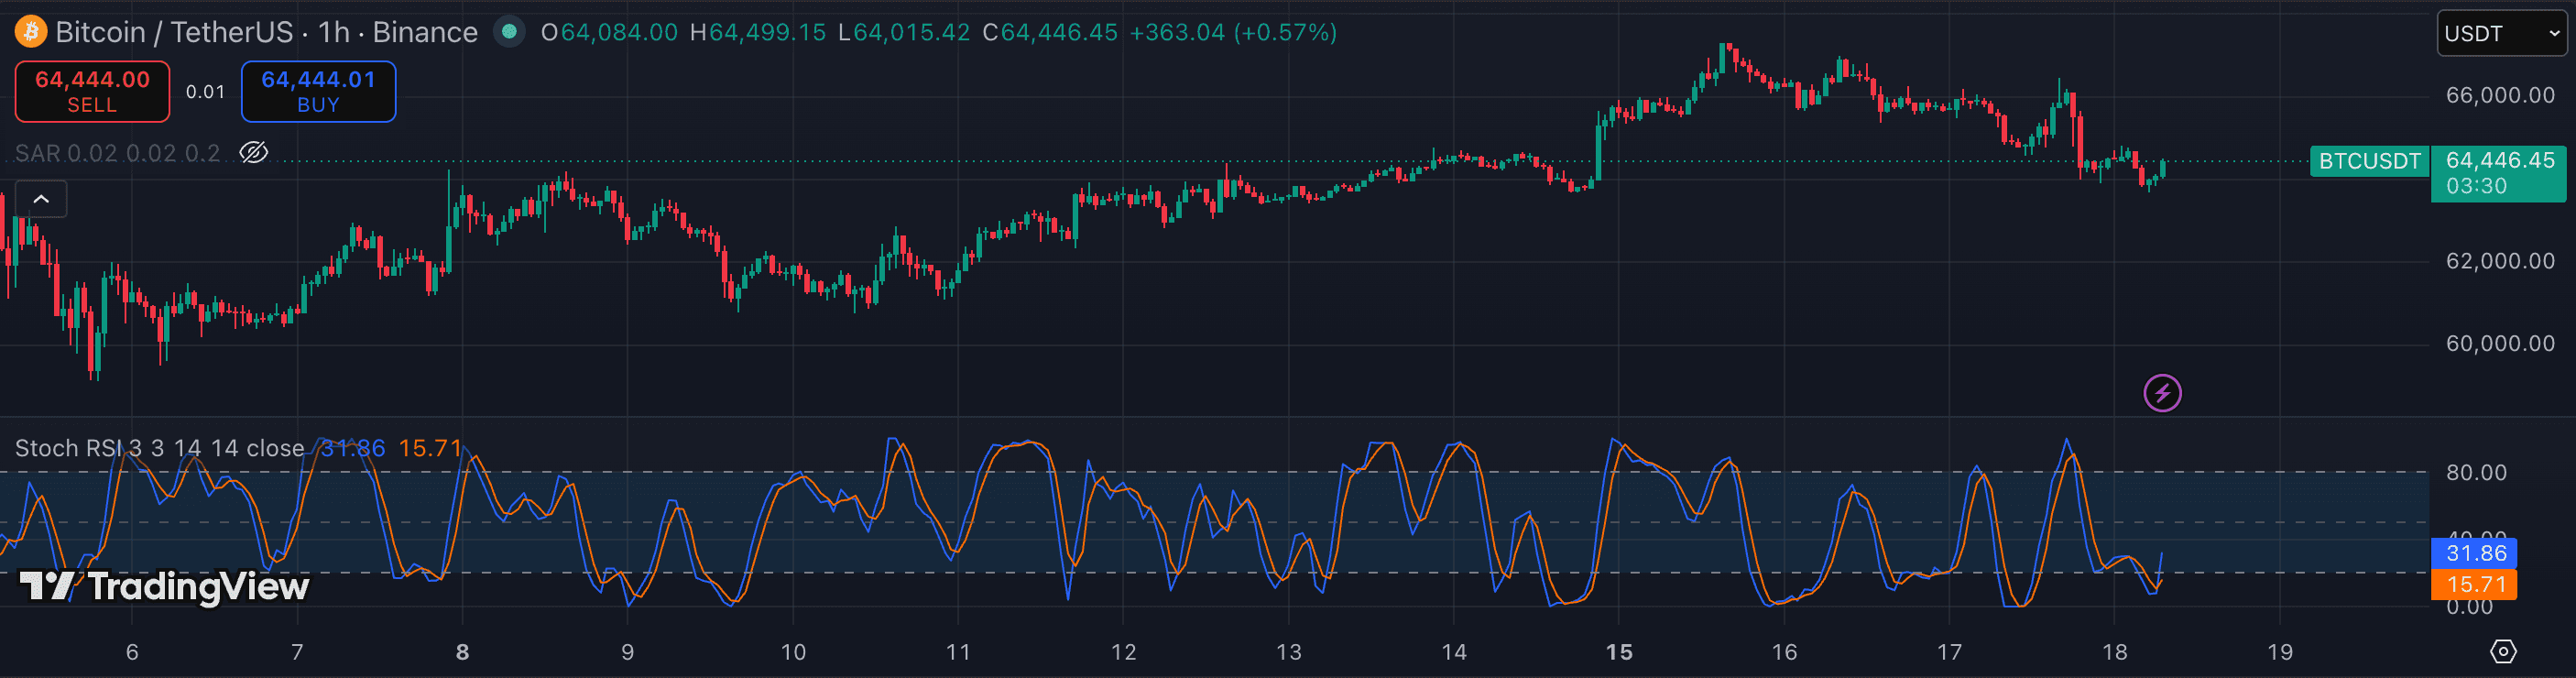
RSI fed into a Stochastic — faster, more sensitive reversals than either alone.
WaveTrend Oscillator
momentumFree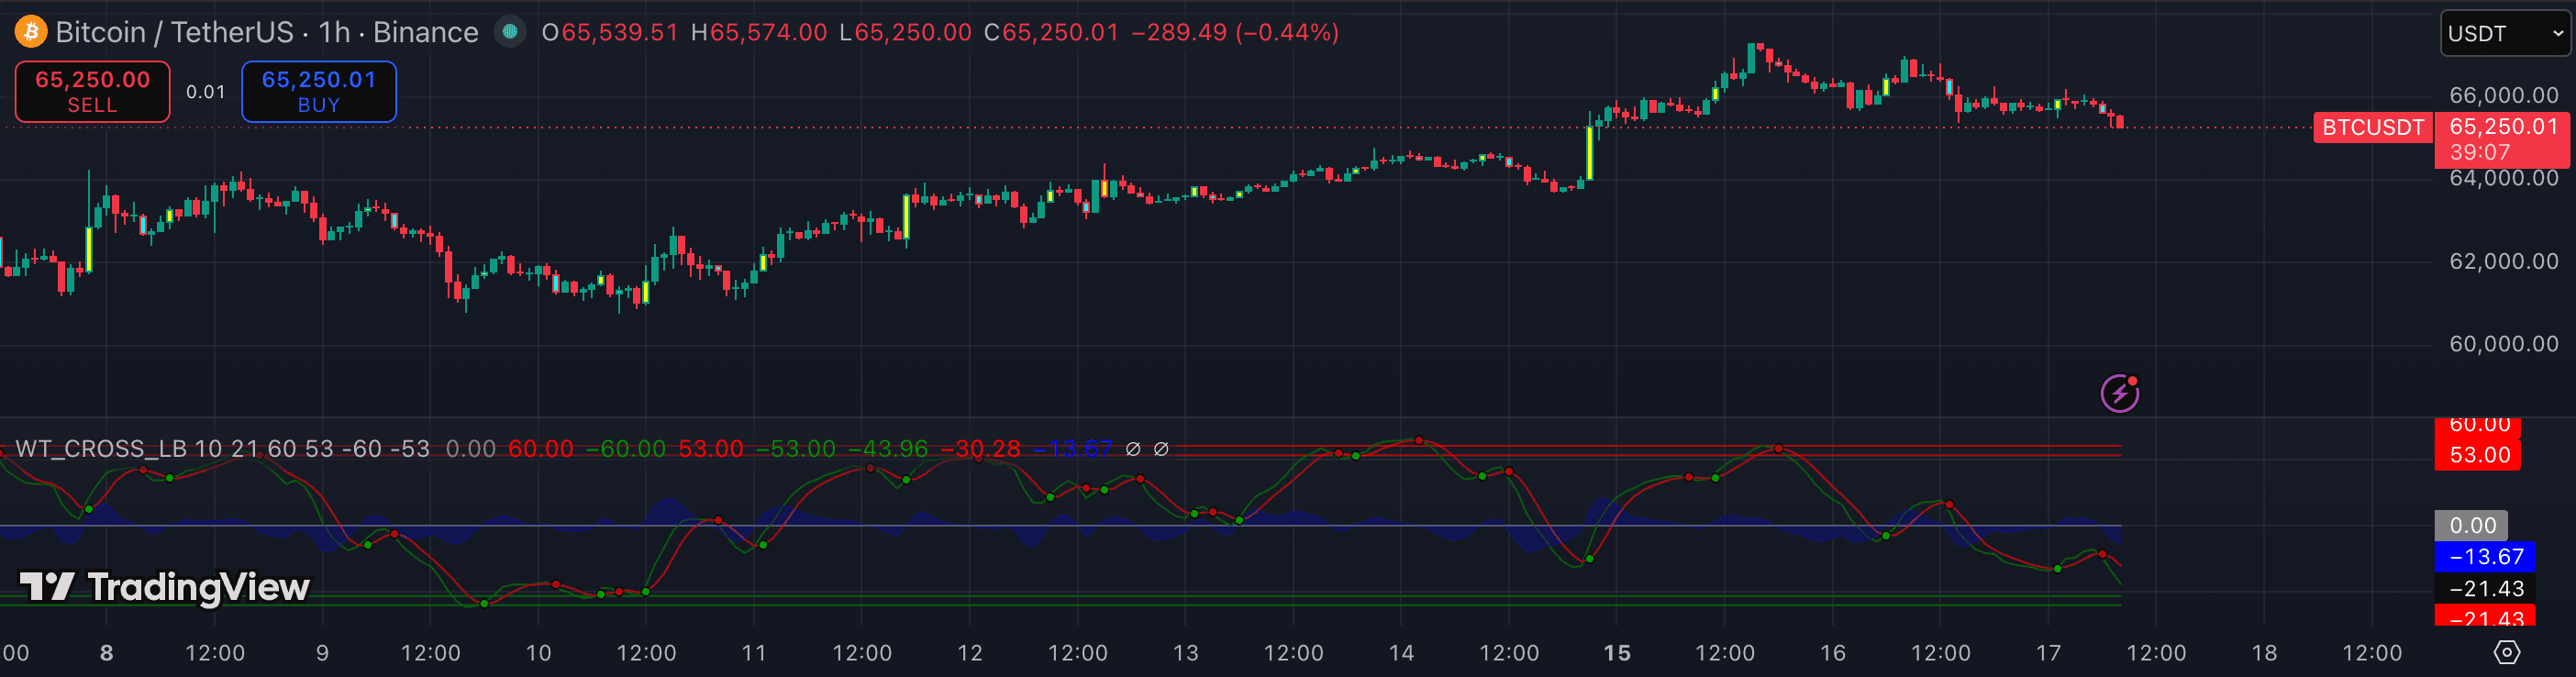
The crypto-favourite momentum oscillator. Divergences that fire early.
The attributes that matter.
| Attribute | RSI | Stochastic RSI | WaveTrend Oscillator |
|---|---|---|---|
| Category | Momentum | Momentum | Momentum |
| Basis | Avg gain ÷ avg loss (0–100) | Stochastic of RSI (14, K=3, D=3) | HLC3 channel deviation → two smoothed lines |
| Output | Single line, 0–100 | %K + %D lines, 0–100 | Two lines (%1 + %2) in oscillator pane |
| Speed / sensitivity | Moderate | Very high — hits extremes frequently | Low-medium — smoother than Stoch RSI |
| Best timeframe | 1h · 4h · 1D | 15m · 1h | 15m · 1h · 4h |
| Divergence quality | ★★★★☆ | ★★☆☆☆ — too noisy | ★★★★☆ — early on alts |
| Best for | Exhaustion reads and divergence on majors | Pullback entry timing in a trend | Momentum crossovers and early reversal signals |
Which should you choose?
RSI, Stochastic RSI, and WaveTrend measure momentum in three distinct ways. RSI calculates the ratio of average gains to average losses over a rolling window — it is the most broadly readable and produces the most reliable divergence signals on liquid pairs like BTC and ETH on 1h and above. The 50 centerline doubles as a regime filter: traders who only go long when RSI is above 50 cut out a large share of counter-trend noise.
Stochastic RSI applies the Stochastic formula to RSI values rather than price. That extra layer makes it extremely sensitive — it hits overbought and oversold levels multiple times per session on 15m charts. This speed makes it a useful entry trigger when a trend context is already established, but it produces too many false signals to be used for standalone reversal calls. Treat it as a timing tool, not a signal generator.
WaveTrend derives its signal from HLC3 price deviations smoothed into two lines. Its crossover (%1 crossing %2) is a mechanical event that RSI doesn't produce — which makes it the most actionable of the three for crossover-style entries. Its divergence quality rivals RSI's on shorter timeframes and on altcoins. The weakness it shares with Stochastic RSI is that both can produce repeated crosses in strong trends, so a trend filter from a separate indicator is essential.
Practical layering: use RSI on the higher timeframe (1h or 4h) to set the momentum regime — above 50 is a bullish context, below 50 is bearish. Use WaveTrend or Stochastic RSI on the entry timeframe to time the actual entry. WaveTrend suits traders who want a crossover trigger; Stochastic RSI suits those who want a fast OB/OS timer. Running all three simultaneously adds redundancy without adding information — pick one for each timeframe layer.
- You want the most reliable divergence read on BTC/ETH 1h–4h
- You use a momentum regime filter (above/below 50) to frame your trades
- You prefer one clean, universally-understood line over multi-line oscillators
- You already have a trend direction and need a fast OB/OS entry timer on 15m–1h
- You scalp pullback entries and want the most sensitive overbought/oversold read of the three
- You treat the oscillator as a timing tool, not a standalone reversal signal
- You want a mechanical crossover trigger (%1 crossing %2) rather than a level read
- You trade altcoins on 15m–1h and want early divergence signals before price confirms
- You already run a separate trend filter to suppress repeated crosses in strong trends
Other comparisons
Not investment advice. PineRadar is an editorial directory — links may be affiliate. Always test indicators on a demo account.