Heikin AshivsRegular Candlesticks
Heikin Ashi and regular candlesticks show you the same market through very different lenses. One smooths away the noise to make trends easier to hold; the other shows you the raw price truth you need to actually execute. Understanding what each one is for — and where each one fails — is the practical knowledge that separates traders who use chart types intentionally from those who just pick a default and wonder why their results are inconsistent. Educational content only; not financial advice.
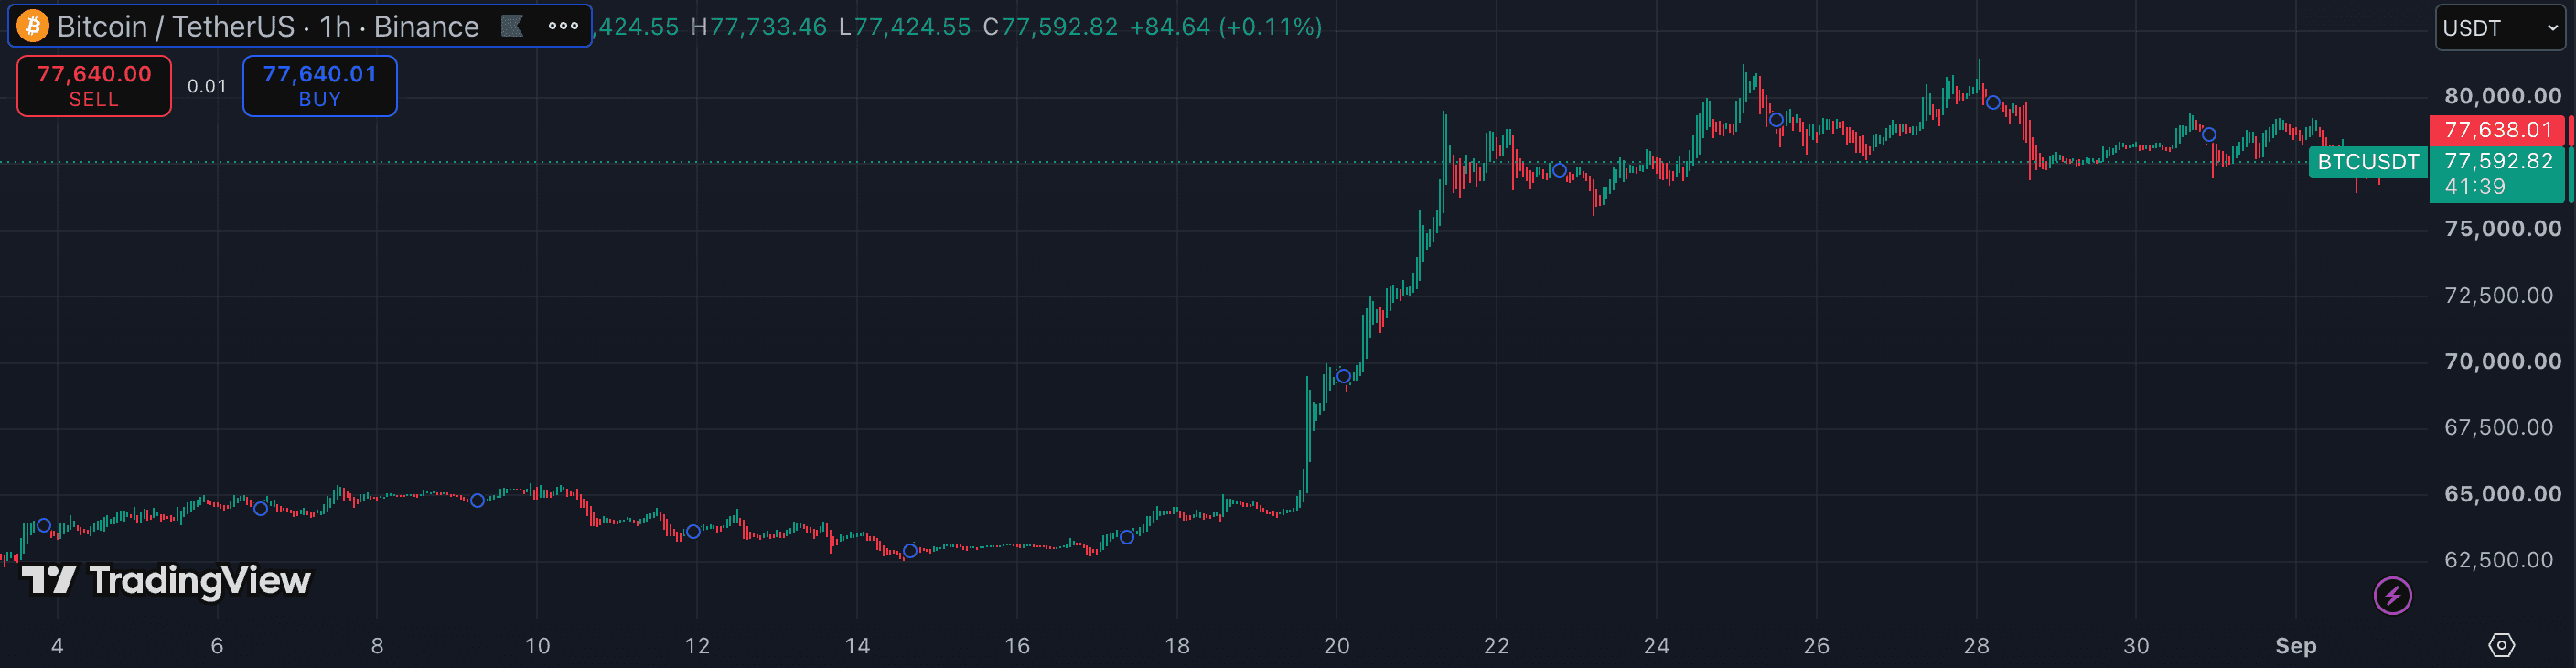
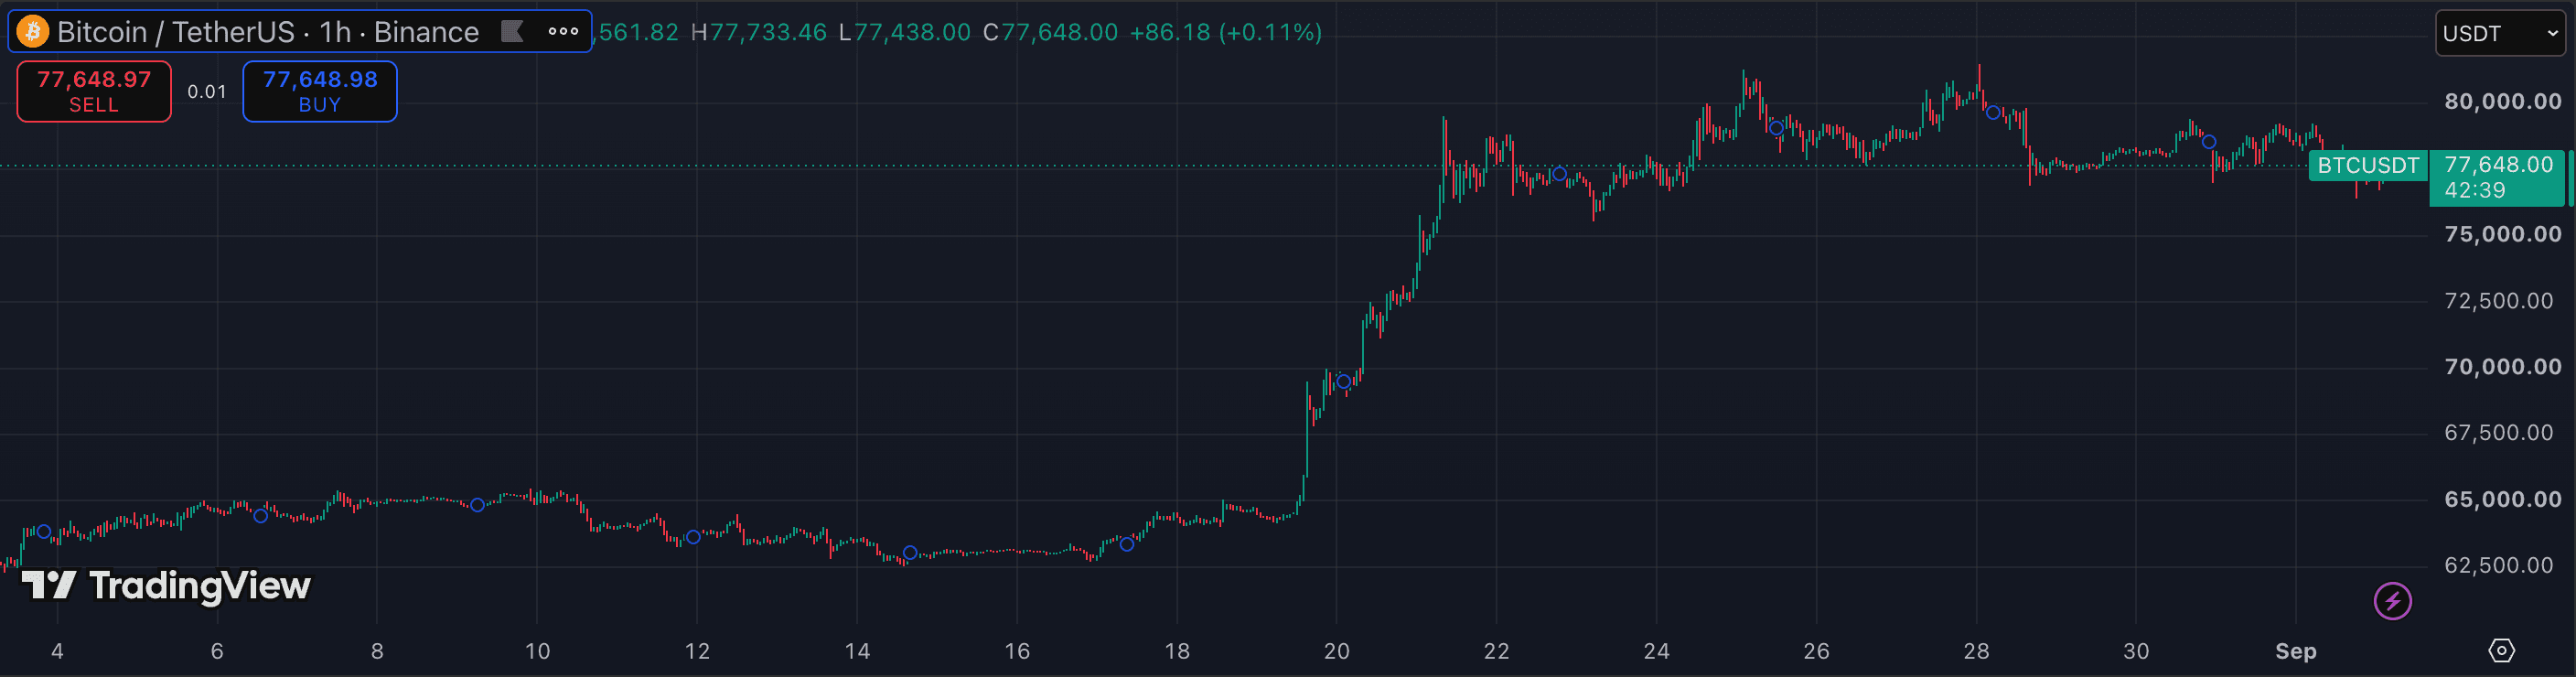
The attributes that matter.
| Attribute | Heikin Ashi | Regular Candlesticks |
|---|---|---|
| Price shown | Averaged synthetic prices | Real OHLC traded prices |
| Trend readability | High — consecutive colour runs | Moderate — noise visible |
| Order entry accuracy | Poor — synthetic prices don't exist | Excellent — exact market prices |
| Stop placement | Not usable — synthetic lows mislead | Accurate — uses real swing lows |
| Lag at reversals | Higher — 1–2 bar delay | None — immediate reaction |
| Noise in trends | Very low — averaging hides pullbacks | High — every tick visible |
| Divergence detection | Poor — synthetic prices distort oscillators | Excellent — oscillators read real prices |
| Best for | Trend context and position holding | Order execution and structure reading |
Which should you choose?
The question 'which chart type is better?' has a specific answer: for trend reading and staying in trades, Heikin Ashi is superior. For executing orders, setting stops, identifying real support and resistance, and running oscillator analysis, regular candlesticks are the only correct choice. Neither replaces the other — they serve fundamentally different purposes.
The most common mistake is using Heikin Ashi for everything. A trader who sets a stop at a HA candle low is placing a stop at a price that was never traded — the real market may not return to that level, or it may have already passed it. A trader who reads RSI divergence on a HA chart is comparing an oscillator built on real prices to a synthetic price series, which can produce misleading divergences.
The practical setup for crypto swing traders: use Heikin Ashi as your trend-reading and position-holding chart — it filters out the pullback candles that cause premature exits in clean trends. Keep a standard candlestick chart (or a OHLC price line) as your execution reference for the same pair and timeframe. Form your trade thesis from HA; place and manage the actual order from standard candles. That division of labour is what both chart types are designed for.
- You hold swing positions and need a cleaner trend-direction read
- You get shaken out by individual red candles in bull trends
- You want to reduce the visual noise on 1h–1D trend charts
- You are placing entry orders or setting stop losses
- You trade using support and resistance levels
- You use RSI, MACD, or other oscillators for signals
Other comparisons
Not investment advice. PineRadar is an editorial directory — links may be affiliate. Always test indicators on a demo account.