Heikin AshivsMoving Average
Both Heikin Ashi and Moving Averages smooth price to reveal trend direction. One recalculates the candles themselves; the other overlays a separate line. Which approach gives you a cleaner read for crypto trend-following?
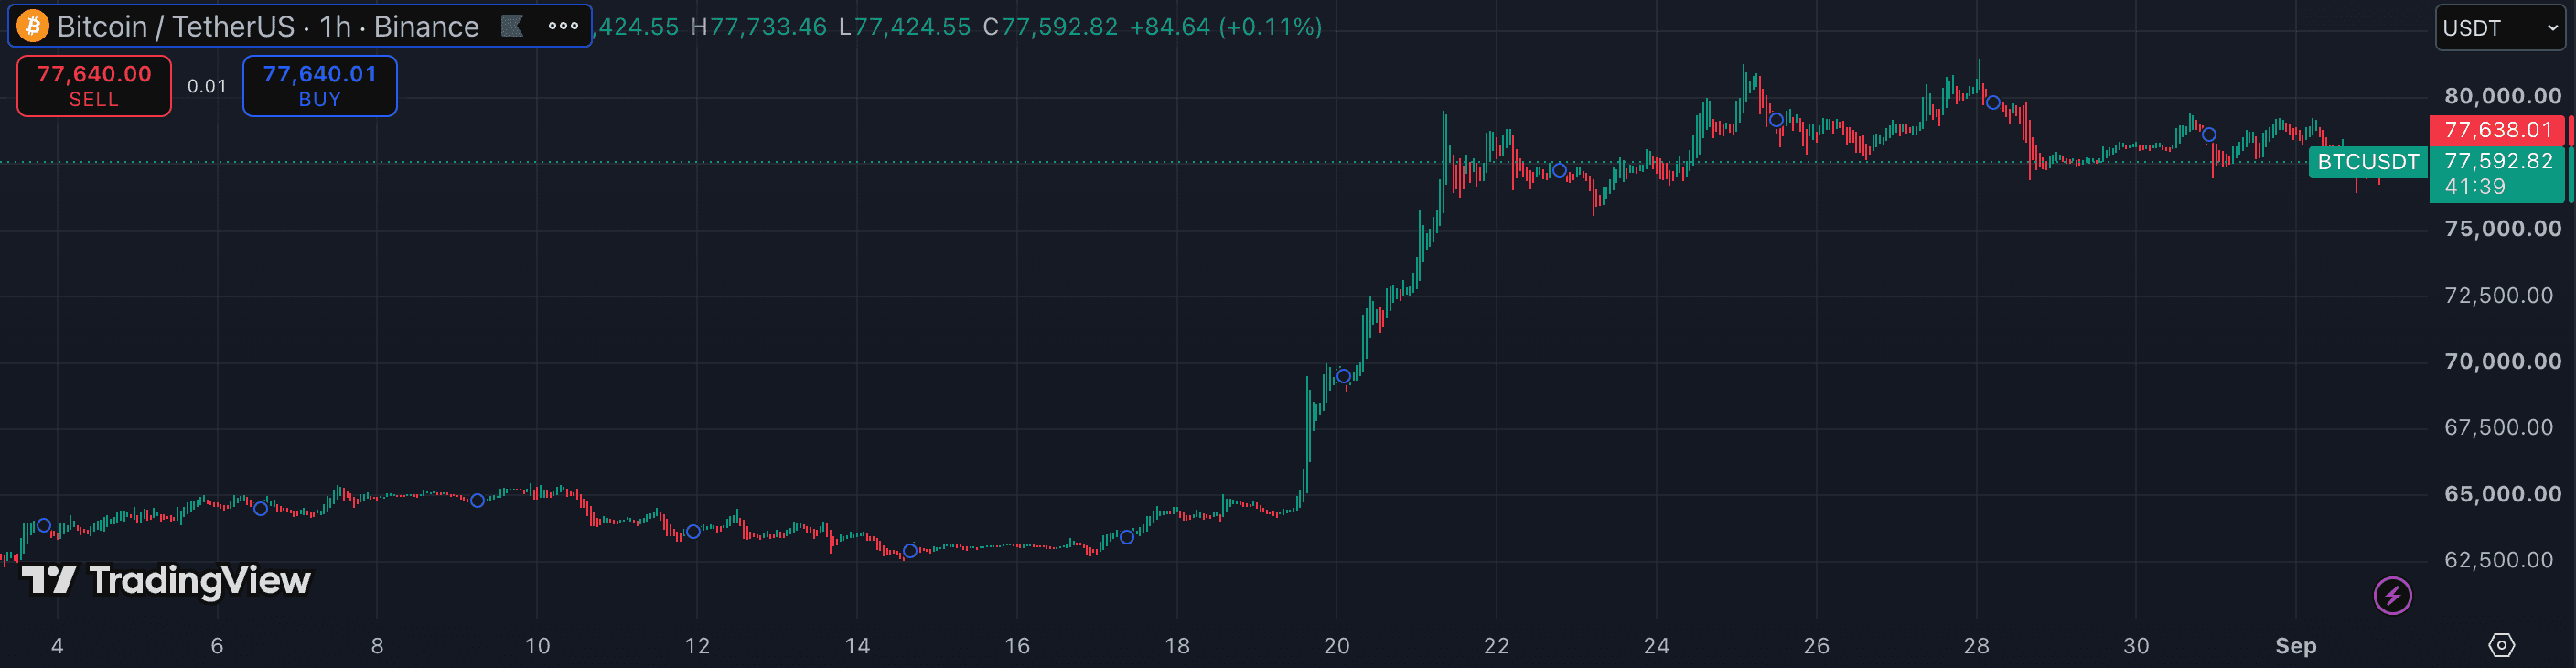
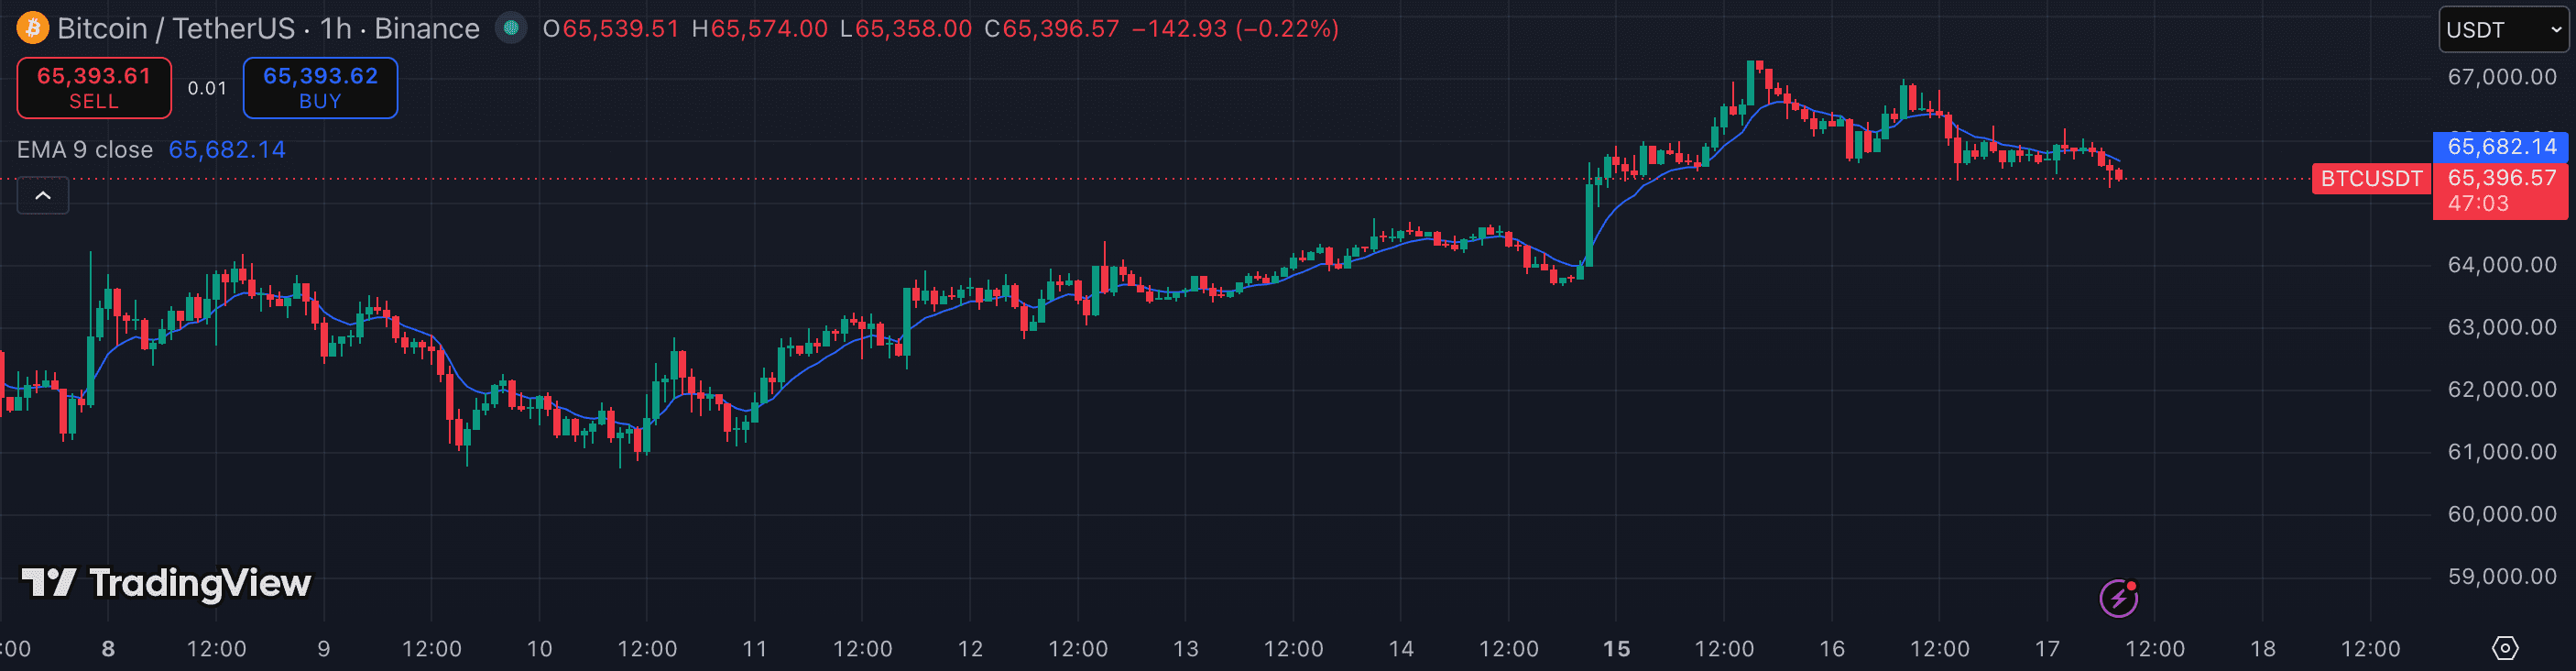
The attributes that matter.
| Attribute | Heikin Ashi | Moving Average |
|---|---|---|
| Type | Chart type (modified candles) | Overlay indicator |
| What it smooths | Open, high, low, close values | Closing prices only |
| Lag | Medium — inherits one-bar averaging | Adjustable — shorter = less lag |
| Trend read | Candle colour and wick structure | Price vs line position |
| Precision pricing | No — synthetic OHLC values | Yes — original price preserved |
| Best timeframe | 1h · 4h · 1D | 15m · 1h · 4h · 1D |
| Best for | Trend-holding, reducing noise | Dynamic S/R, trend direction bias |
| Worst in | Scalping, precise entries | Ranging, whipsaw markets |
Which should you choose?
Heikin Ashi gives you a fuller picture of trend momentum through the candle series itself — a block of uniform green candles with small lower shadows is a cleaner trend-continuation read than a price line sitting above a moving average. It also handles the visual noise of volatile crypto better because it smooths both the open and close, not just the close.
A moving average wins on precision: price still reflects real traded levels, so you can set stops against actual swing highs/lows and execute entries from real candles. You also get a configurable lag — a 21 EMA reacts much faster than a 50 EMA, giving you flexibility Heikin Ashi doesn't offer.
The best setup uses both together: a moving average for directional bias and stop reference, Heikin Ashi (on a second pane or tab) for trend-hold confidence checks. Use the real candle chart for execution.
- You hold swing or position trades and want to reduce emotional exits
- You want a clean visual read of whether momentum is intact or fading
- You are comfortable executing from a separate real-candle chart
- You need exact price levels for entries, stops, and targets
- You want a customisable lag — shorter for scalps, longer for swing
- You pair indicators that calculate from real OHLC data
Other comparisons
Not investment advice. PineRadar is an editorial directory — links may be affiliate. Always test indicators on a demo account.