MACDvsStochastic RSI
MACD and Stochastic RSI both live in the momentum toolkit, but they answer different timing questions. MACD reads whether trend momentum is building or fading; Stochastic RSI is a much faster entry-timing oscillator derived from RSI itself. This comparison explains which one belongs in the primary momentum pane and when the faster tool is useful only after context is already set. Educational content only; not financial advice.
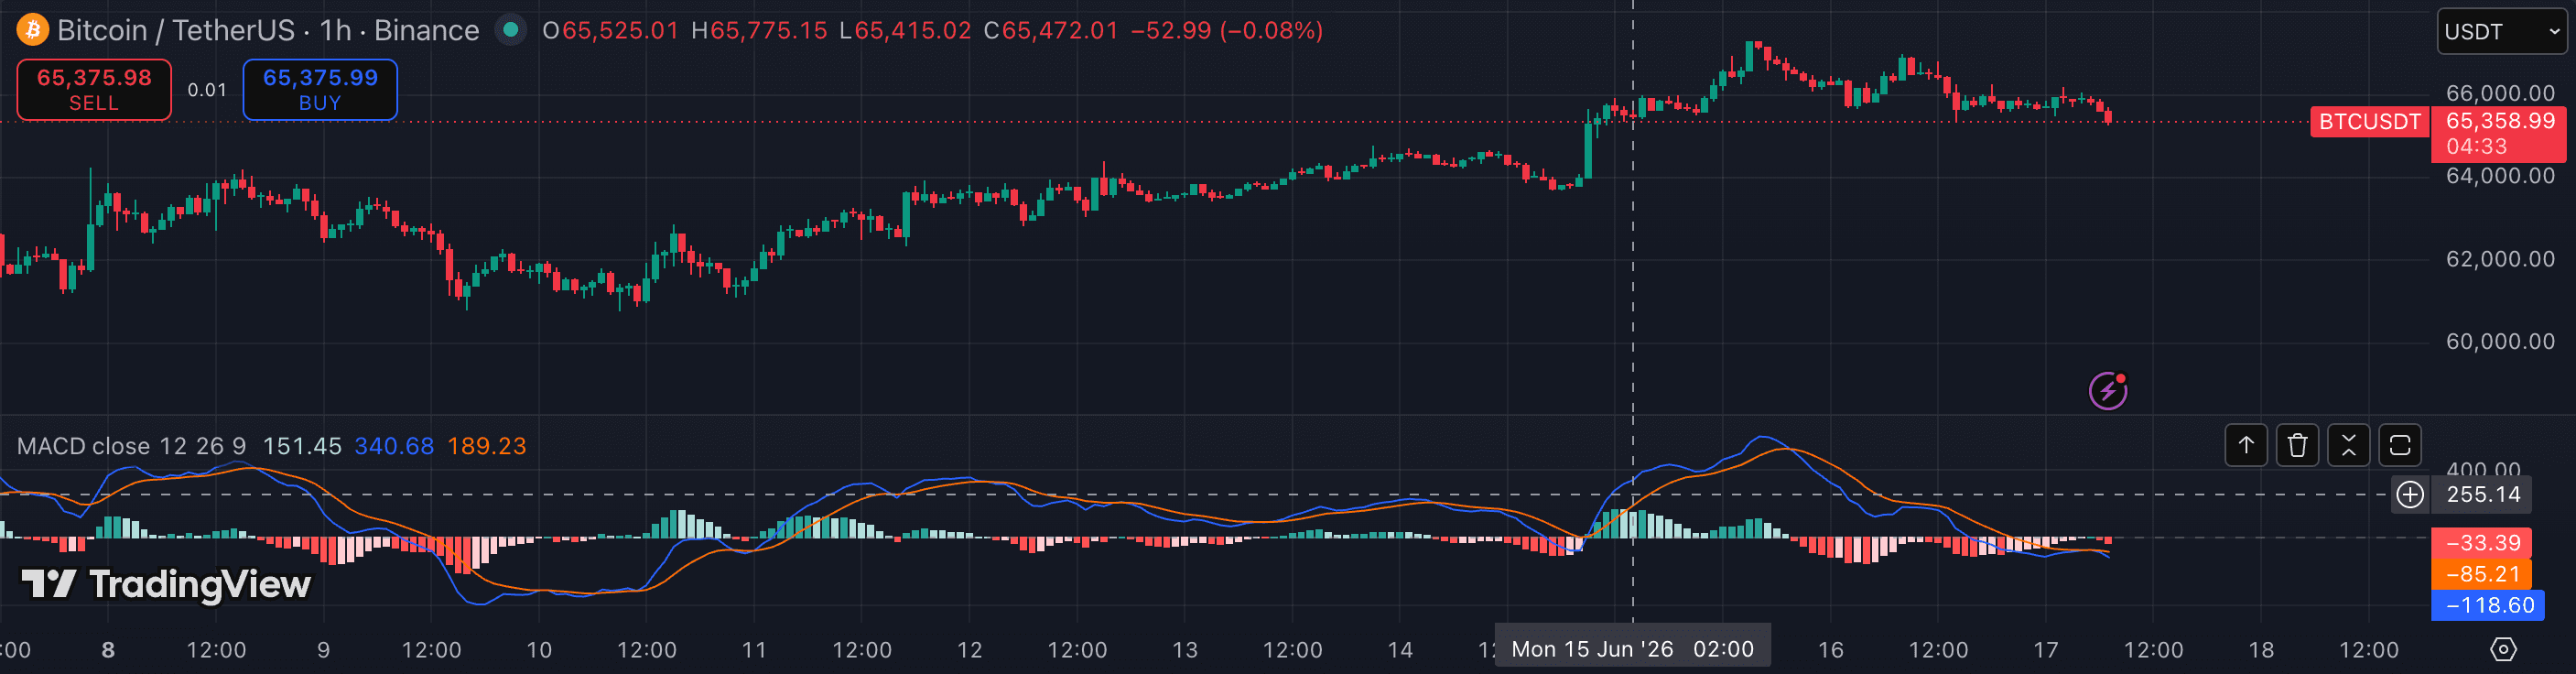
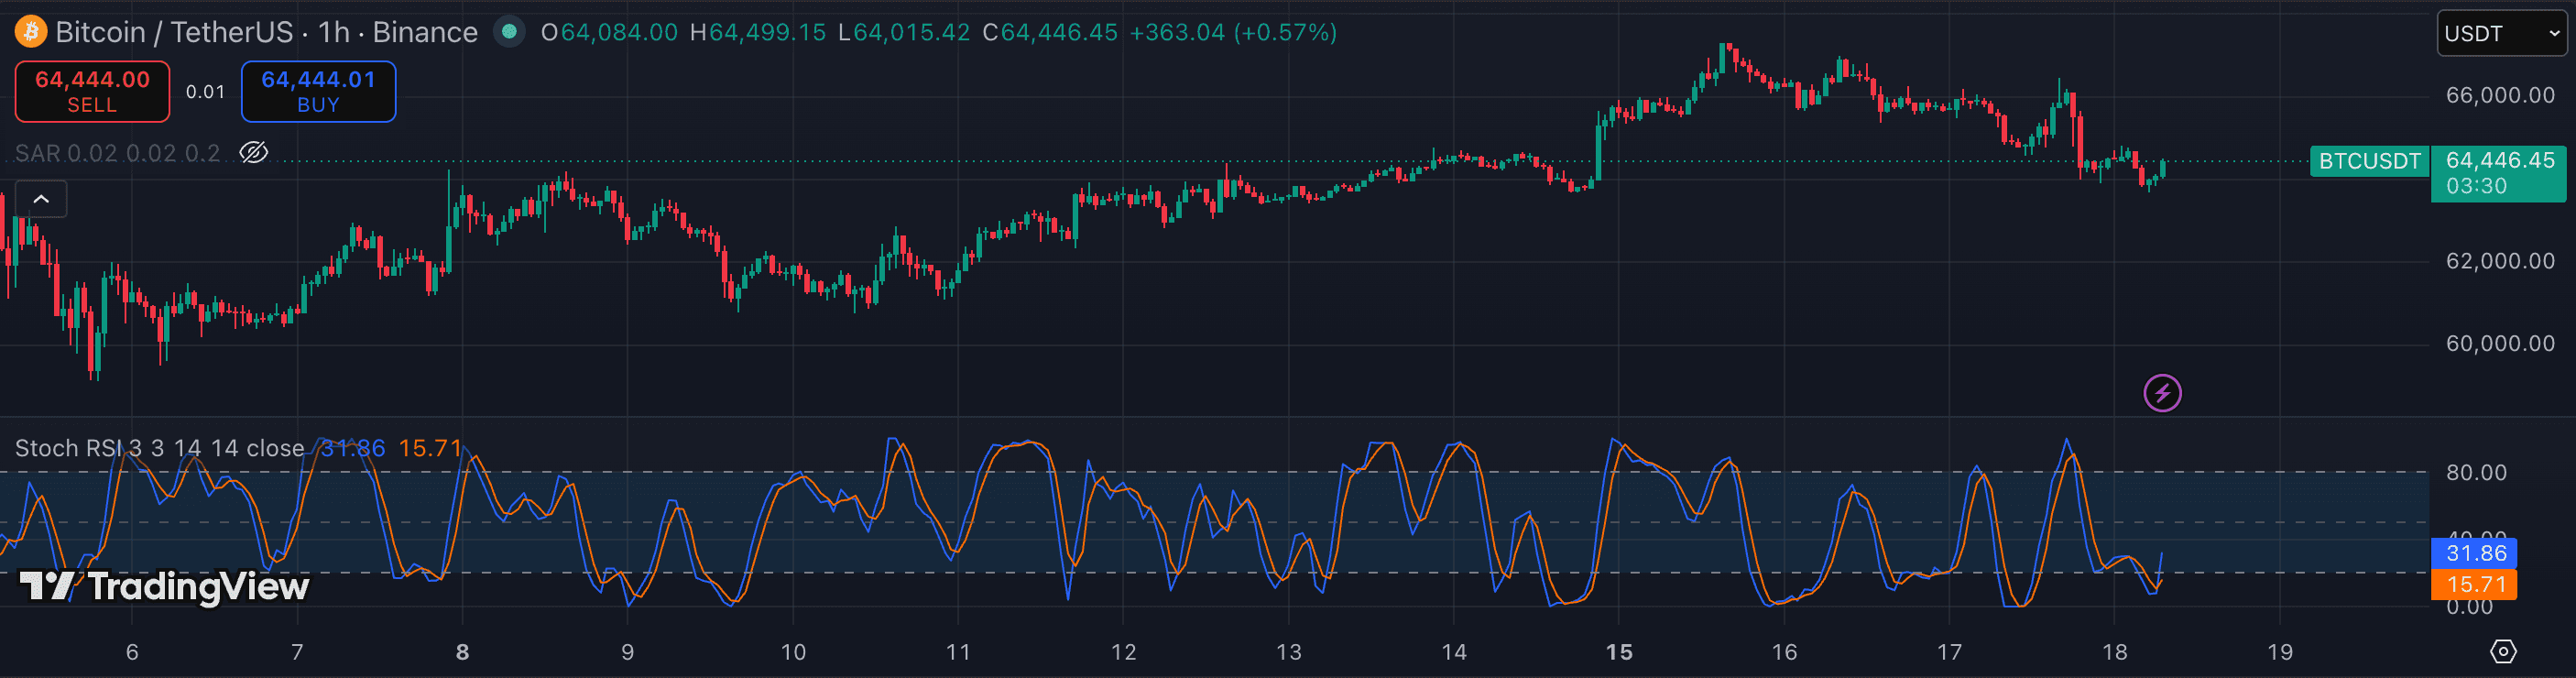
The attributes that matter.
| Attribute | MACD | Stochastic RSI |
|---|---|---|
| Category | Momentum + trend | Momentum oscillator |
| Calculation | 12/26 EMA spread + 9 signal line | Stochastic formula applied to RSI |
| Output | MACD line, signal line, histogram | %K + %D lines, 0–100 |
| Sensitivity | Medium — smoother trend read | Very high — reaches extremes often |
| Best timeframe | 1h · 4h · 1D | 15m · 1h |
| Best for | Trend confirmation and histogram divergence | Pullback timing after bias is set |
| Worst in | Sideways ranges with repeated false crosses | Standalone reversal calls in chop |
| Primary weakness | Lag at fast turns | Too many signals without a filter |
Which should you choose?
MACD is the broader momentum read. The zero line tells you whether the market is operating in a positive or negative momentum regime, while the histogram shows whether that momentum is expanding or fading. It lags because it is built from EMAs, but that same smoothing makes it more useful as a primary trend-and-momentum dashboard on 1h and above.
Stochastic RSI is the faster timing tool. Because it applies a stochastic calculation to RSI values rather than directly to price, it reaches overbought and oversold zones frequently. That makes it helpful for timing a pullback inside an already-defined trend, but noisy when used as the only signal on a chart.
A clean workflow uses MACD first and Stochastic RSI second: MACD frames the momentum regime, then Stochastic RSI helps time a lower-timeframe pullback or reset. If only one pane is available for a general crypto swing chart, MACD usually carries more information per signal; Stochastic RSI is more useful as a specialised trigger once the directional context is already established.
- You want trend direction and momentum strength in one indicator
- You trade 1h–1D charts and care about histogram divergence
- You prefer fewer, slower signals that describe the broader regime
- You already have a higher-timeframe trend or structure bias
- You need a fast oscillator for timing pullbacks on 15m–1h
- You are comfortable filtering frequent overbought/oversold signals
Other comparisons
Not investment advice. PineRadar is an editorial directory — links may be affiliate. Always test indicators on a demo account.