Regular CandlesticksvsMoving Average
Regular Candlesticks and Moving Averages are the two baseline ways traders read trend on TradingView: raw OHLC price first, smoothed trend line second. They are often placed on the same chart, but they should not be treated as interchangeable. This comparison explains when the raw candle structure matters more than smoothing, when a moving average earns its overlay space, and how to use both without turning either into investment advice. Educational content only; not financial advice.
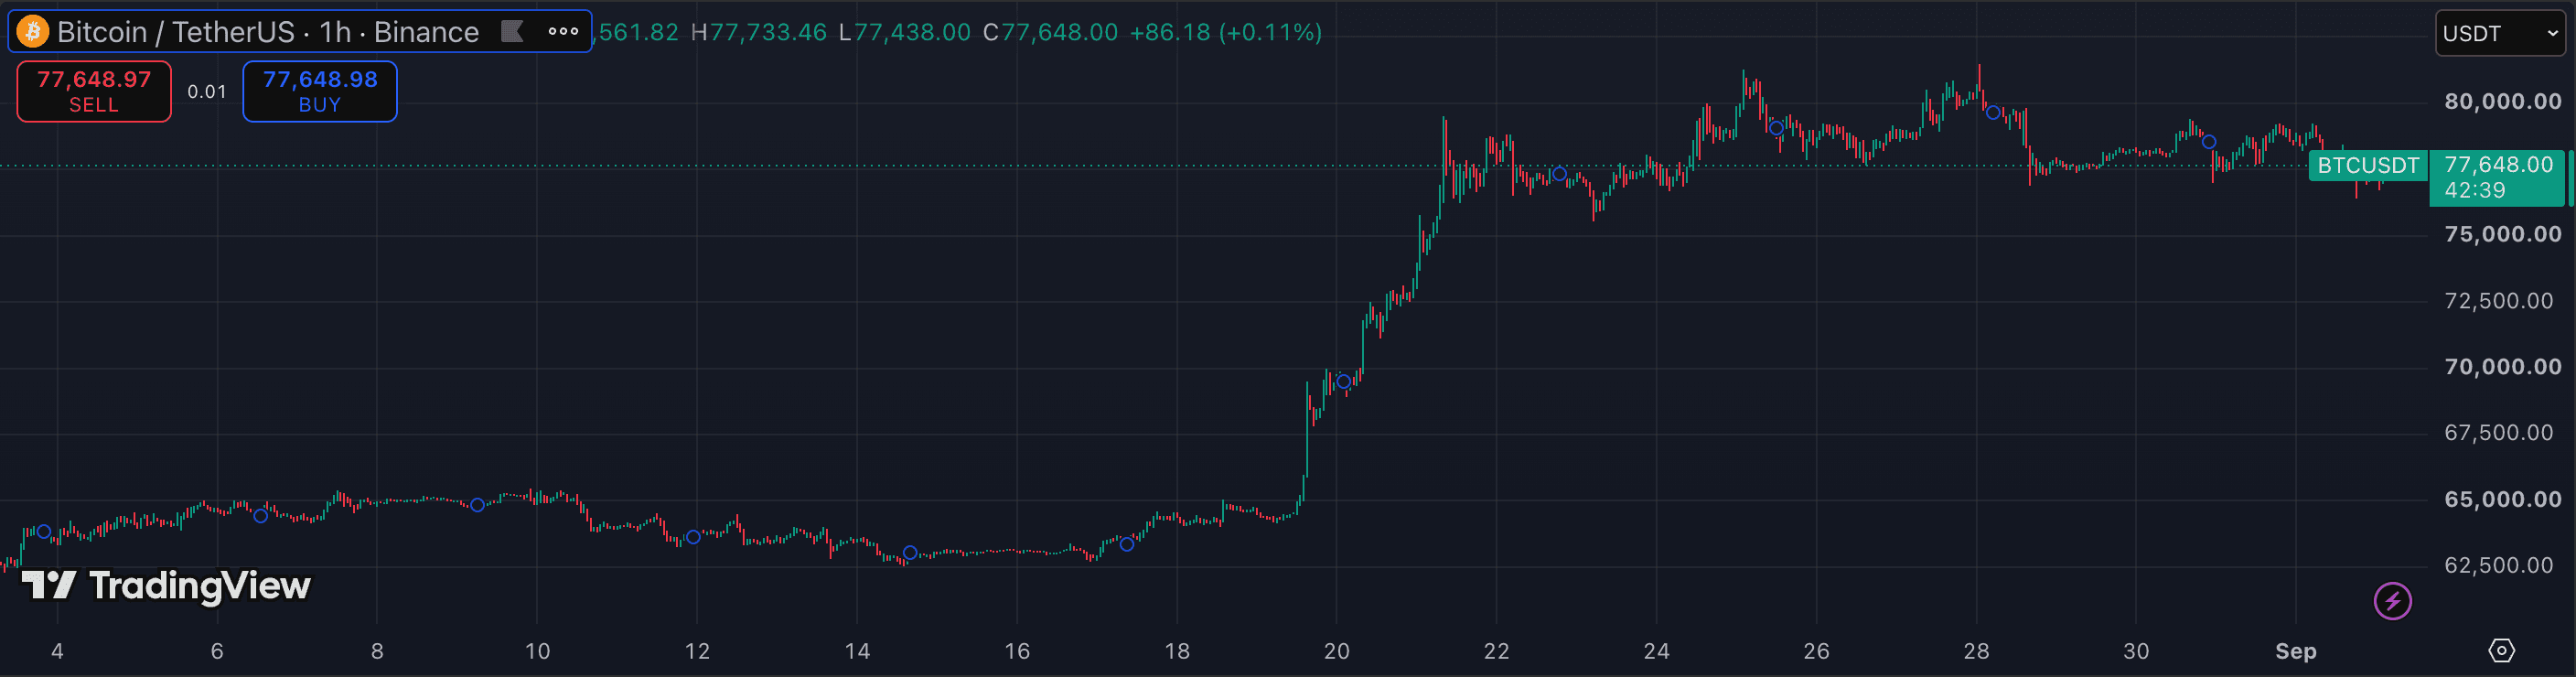
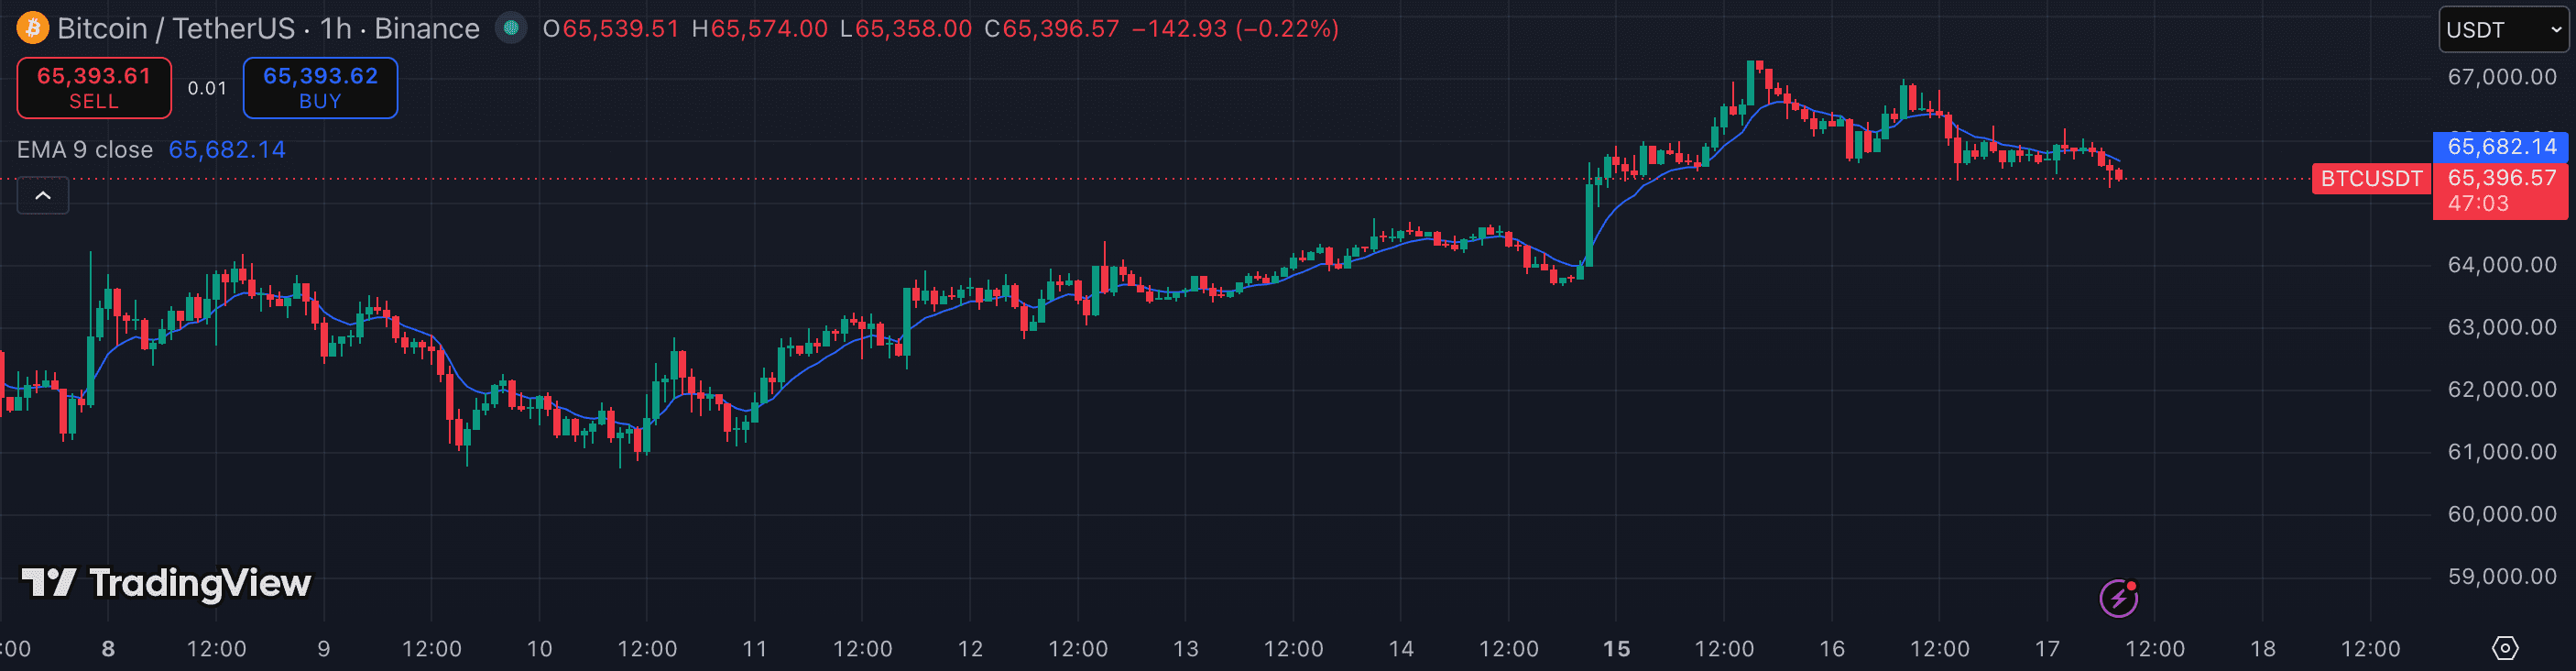
The attributes that matter.
| Attribute | Regular Candlesticks | Moving Average |
|---|---|---|
| Category | Chart type / raw price | Trend overlay |
| Input | Actual open, high, low, close | Rolling average of price |
| Output | Bodies and wicks for each bar | One or more smoothed lines |
| Lag | None — raw market print | Built in — depends on length and MA type |
| Best timeframe | All timeframes | 15m · 1h · 4h · 1D |
| Best for | Execution levels, structure, wick behaviour | Trend bias and dynamic S/R |
| Worst in | Very noisy low-timeframe tape | Sideways chop and late reversals |
| Decision role | Source of truth for price | Context layer for trend |
Which should you choose?
Regular candlesticks are the source-of-truth chart type because they show the actual OHLC prices that traded. Swing highs, swing lows, support and resistance, wick reactions, and execution levels all come from the real candle chart. A moving average can clarify direction, but it cannot replace the raw price structure that orders and stops are anchored to.
A Moving Average earns its place when the question is trend context rather than exact price. A 20/50/200 EMA stack quickly shows whether price is above or below the prevailing trend line, and it gives a cleaner visual bias during noisy crypto sessions. The trade-off is lag: by smoothing price, the line necessarily reacts after the market has already moved.
The practical setup is layered: read standard candles for actual levels and structure, then use the moving average as a secondary trend filter. If they conflict, the candle chart explains what happened; the moving average explains whether that move is still aligned with the broader trend. Neither tool is a standalone instruction to enter or exit a market.
- You need exact OHLC levels for structure and execution planning
- You read wicks, candle bodies, swing highs, and swing lows directly
- You want the baseline chart that every other indicator is calculated from
- You want a smoother trend-bias line over the raw candle noise
- You use dynamic support/resistance rather than only horizontal levels
- You compare short, medium, and long trend regimes with an EMA stack
Other comparisons
Not investment advice. PineRadar is an editorial directory — links may be affiliate. Always test indicators on a demo account.