Ichimoku CloudvsHeikin Ashi
Ichimoku Cloud and Heikin Ashi both make trend direction easier to see, but they change the chart in different ways. Ichimoku overlays a multi-part framework on real prices; Heikin Ashi replaces the candles with a smoothed synthetic series. This comparison explains which tool fits a higher-timeframe analysis workflow and which is better for a cleaner visual trend read. Educational content only; not financial advice.
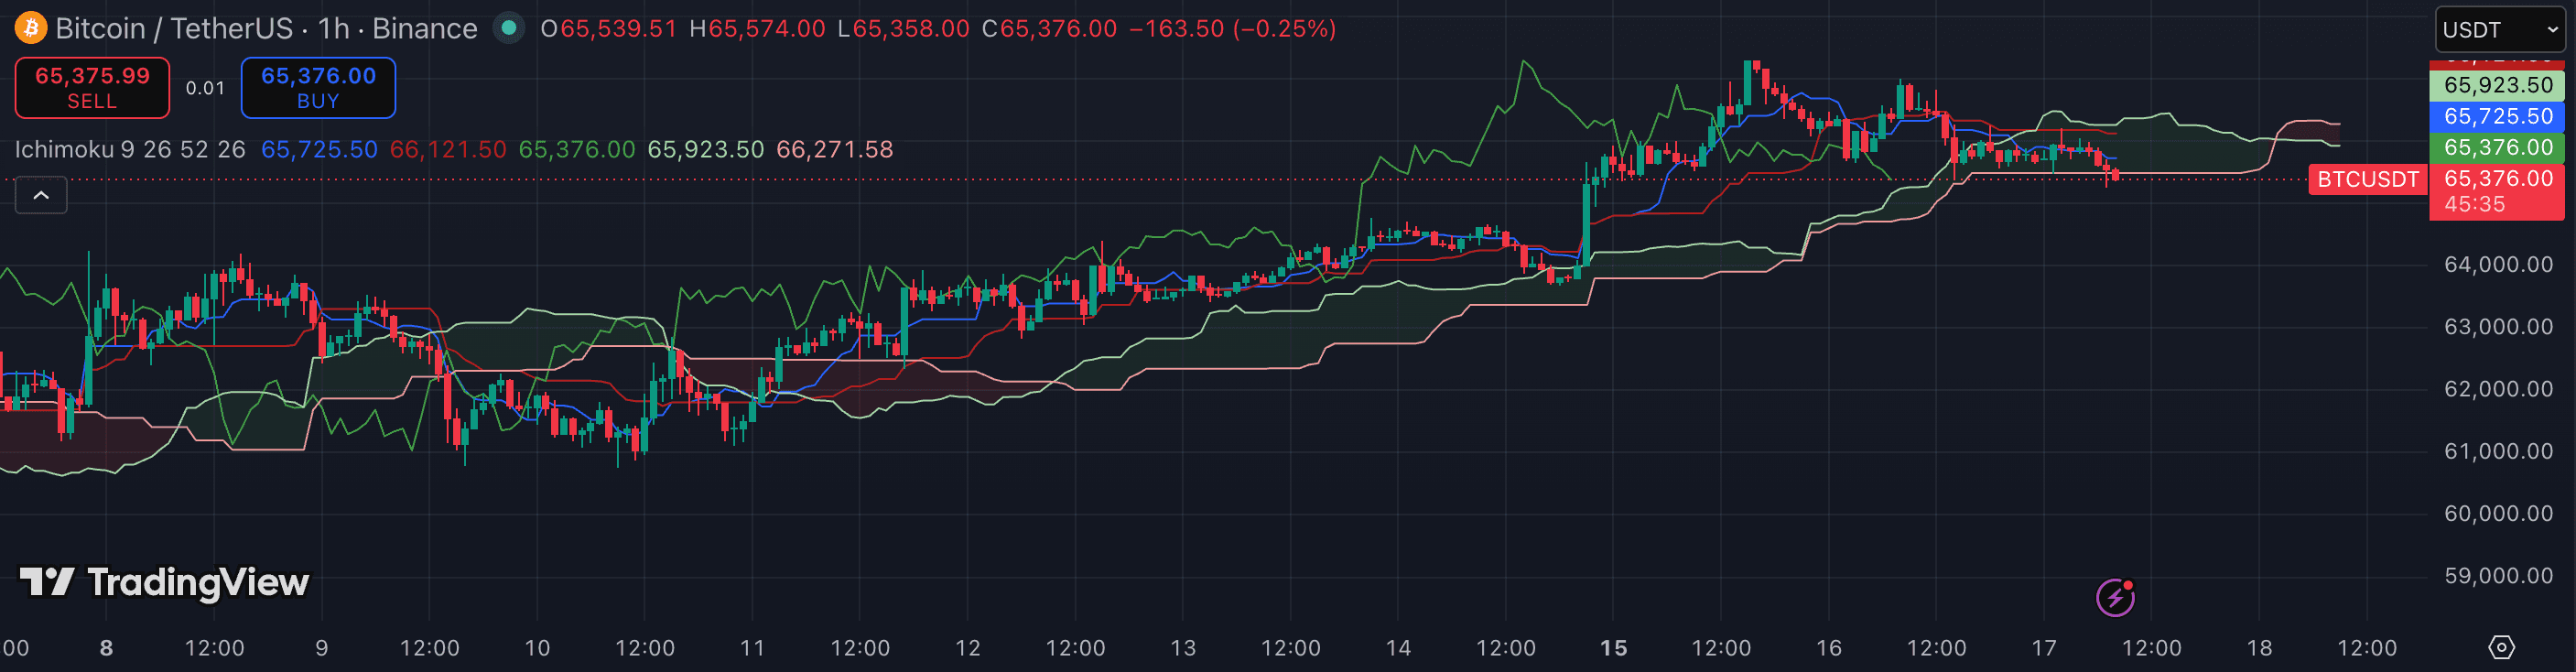
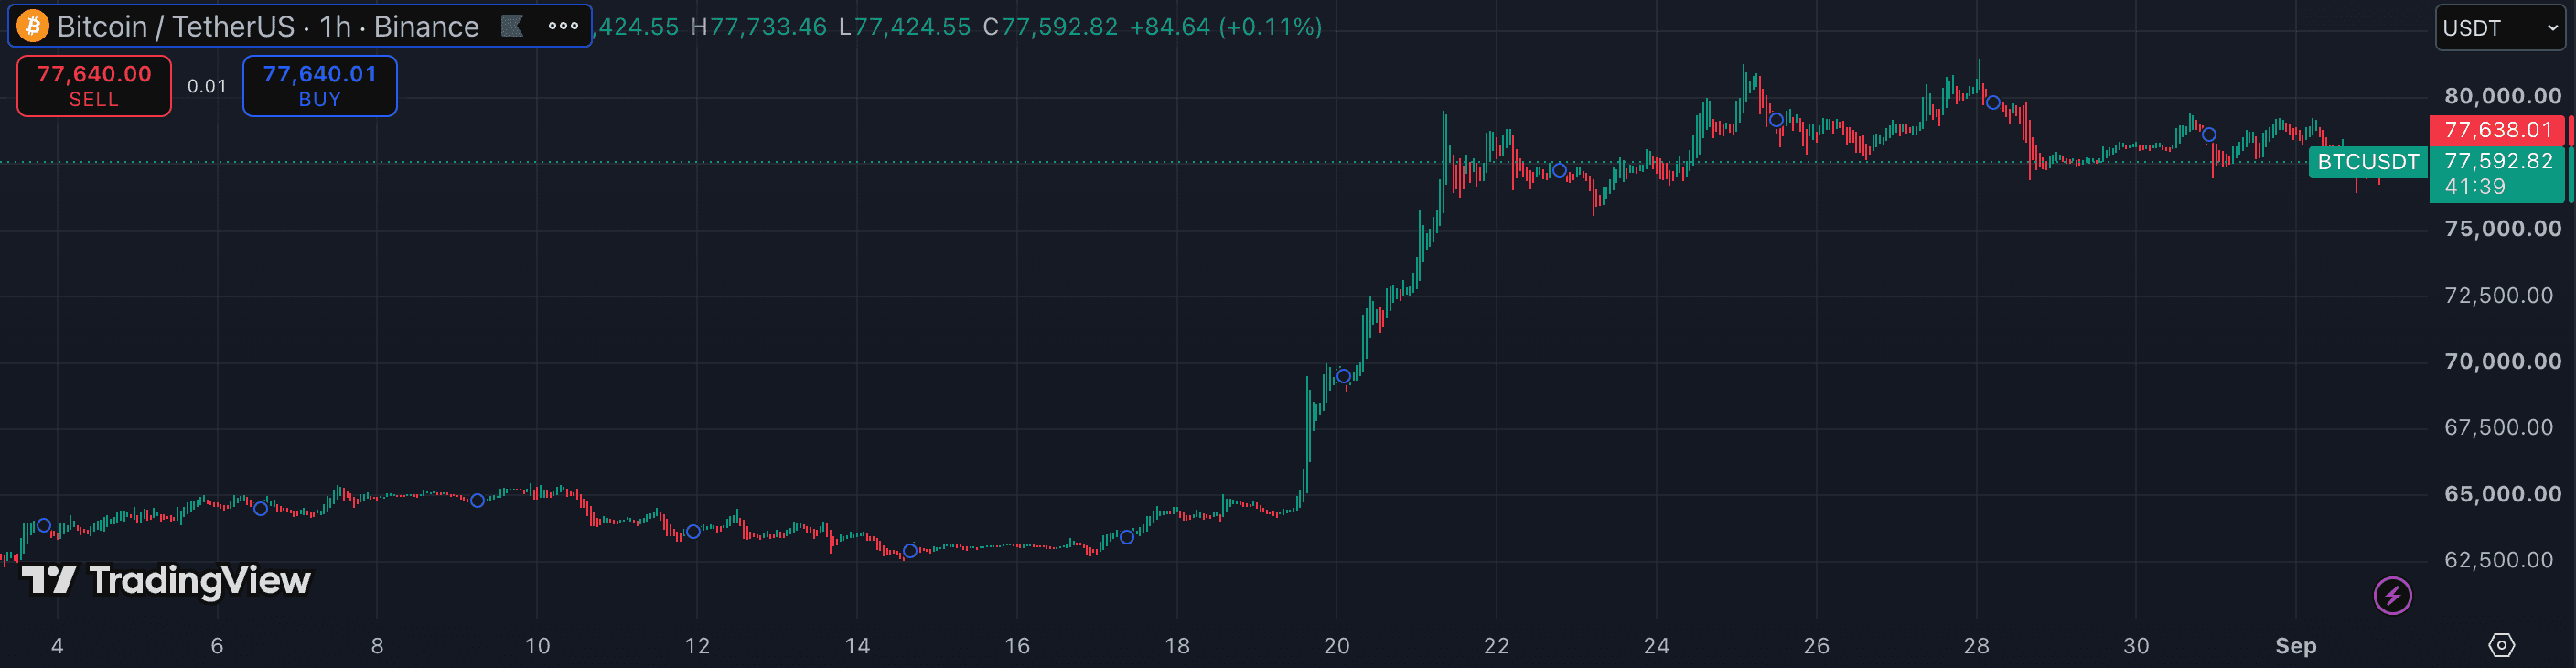
The attributes that matter.
| Attribute | Ichimoku Cloud | Heikin Ashi |
|---|---|---|
| Tool type | Five-line overlay with projected cloud | Alternative candle chart type |
| Price basis | Uses real chart prices for its calculations | Displays averaged, synthetic OHLC values |
| Primary read | Trend, momentum, and support/resistance context | Trend persistence through candle colour and wick structure |
| Best timeframe | 4h · 1D · 1W | 1h · 4h · 1D |
| Complexity | High — five components must be interpreted | Low — read colour runs and shadows |
| Forward context | Yes — the cloud is projected 26 bars ahead | No — smoothing describes the current and past trend |
| Execution prices | Available because regular candles remain visible | Not reliable — displayed OHLC values are synthetic |
| Best for | A complete higher-timeframe trend framework | Reducing visual noise while monitoring a trend |
Which should you choose?
Ichimoku Cloud is the more complete analysis tool. Price relative to the cloud frames the trend, the Conversion and Base lines add momentum context, and the projected cloud maps possible future support and resistance. Because it remains an overlay on a regular price chart, the underlying candles can still provide real traded levels. The trade-off is screen density and a steeper learning curve.
Heikin Ashi is the simpler visual filter. Consecutive same-colour candles and changes in wick structure make trend persistence easier to scan, especially when ordinary candles look noisy. Its limitation is fundamental: the displayed opens and closes are averaged values, so a separate regular-candle view is still needed for exact prices and structure.
For a single higher-timeframe framework, Ichimoku Cloud is usually the better first choice because it provides direction, momentum, and projected context without replacing real prices. Choose Heikin Ashi when the main goal is a cleaner trend-holding view and you are comfortable checking a regular chart for execution and level analysis. The tools can also be layered carefully, but doing so may hide the price detail that makes Ichimoku useful.
- You analyse 4h–1W charts and want one structured trend framework
- You need projected support/resistance alongside trend direction
- You are comfortable learning the cloud, line crosses, and lagging span
- You want to reduce candle noise with the simplest possible visual read
- You monitor trend persistence through colour runs and wick changes
- You keep a separate regular-candle chart for real prices and structure
Other comparisons
Not investment advice. PineRadar is an editorial directory — links may be affiliate. Always test indicators on a demo account.