ATRvsKeltner Channels
ATR and Keltner Channels both use true range to describe volatility, but they present it differently. ATR compresses recent movement into one direction-neutral value; Keltner Channels place an ATR-based envelope around an EMA on the price chart. This comparison explains when the raw volatility measure is enough and when the channel overlay adds useful context. Educational content only; not financial advice.
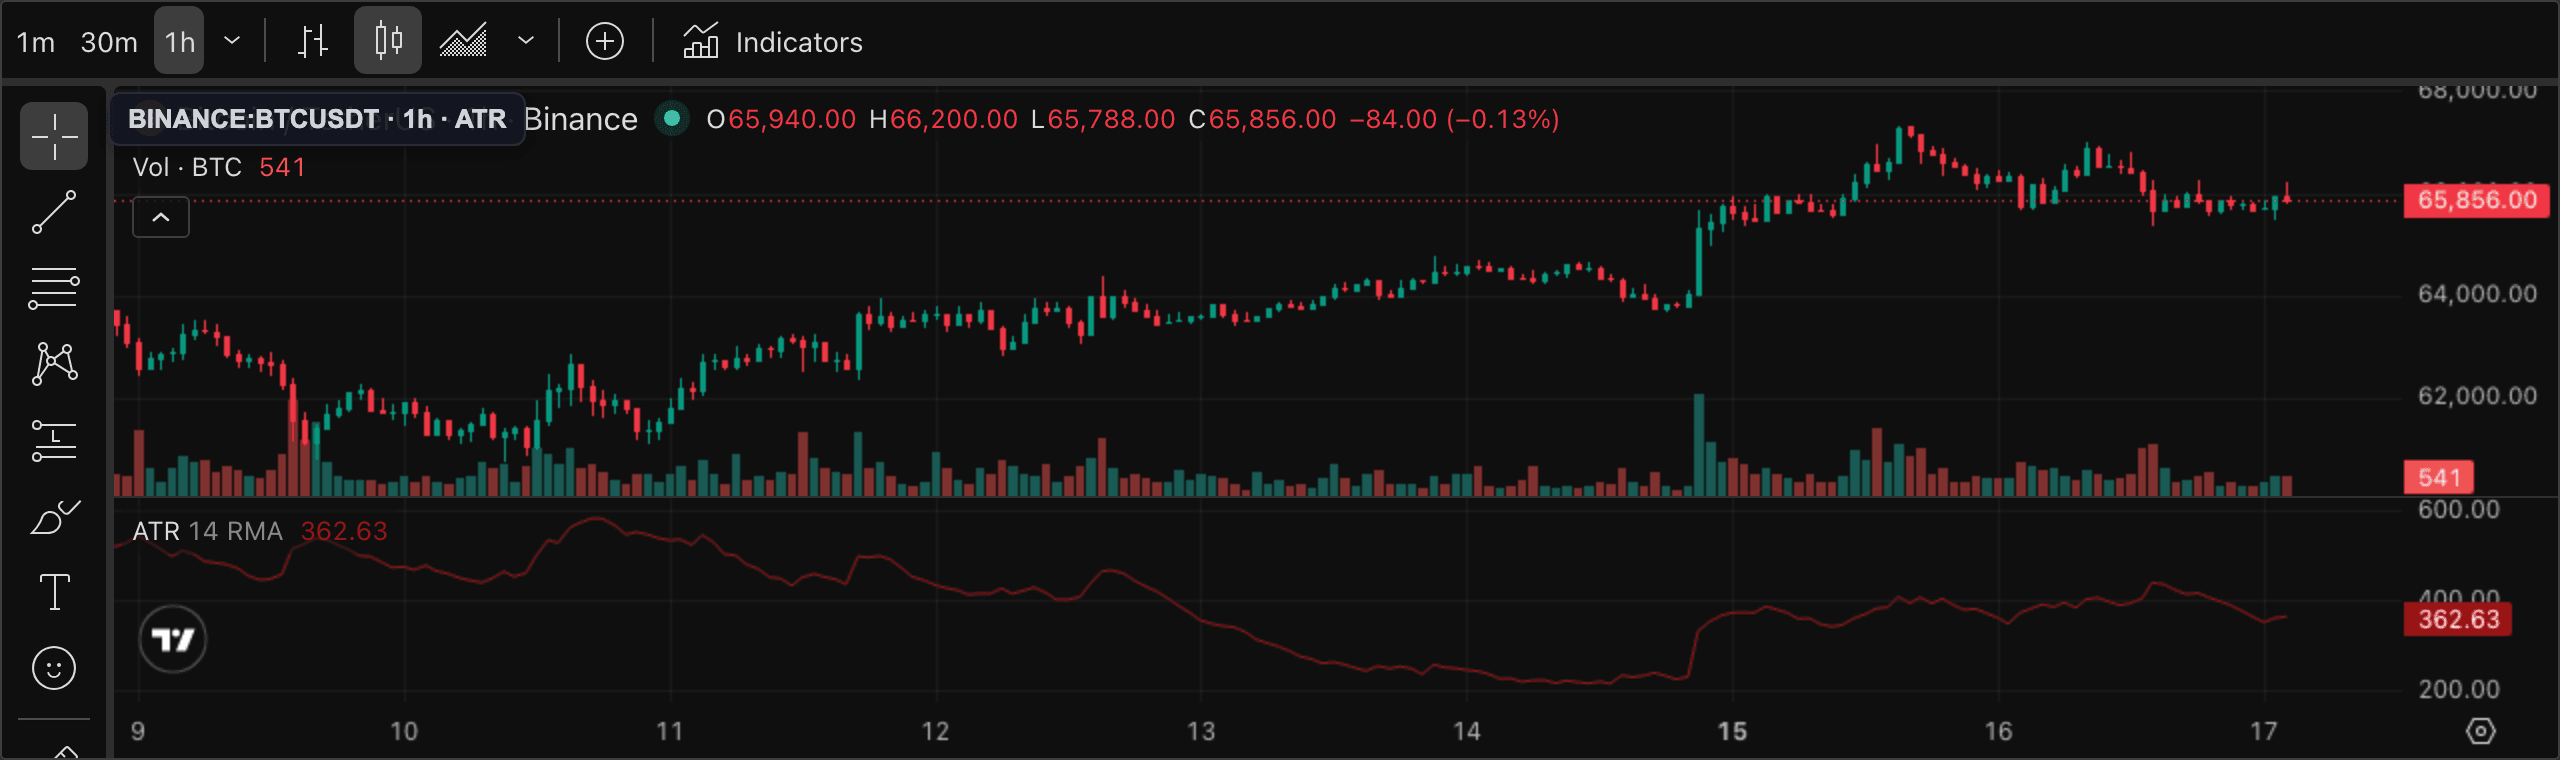
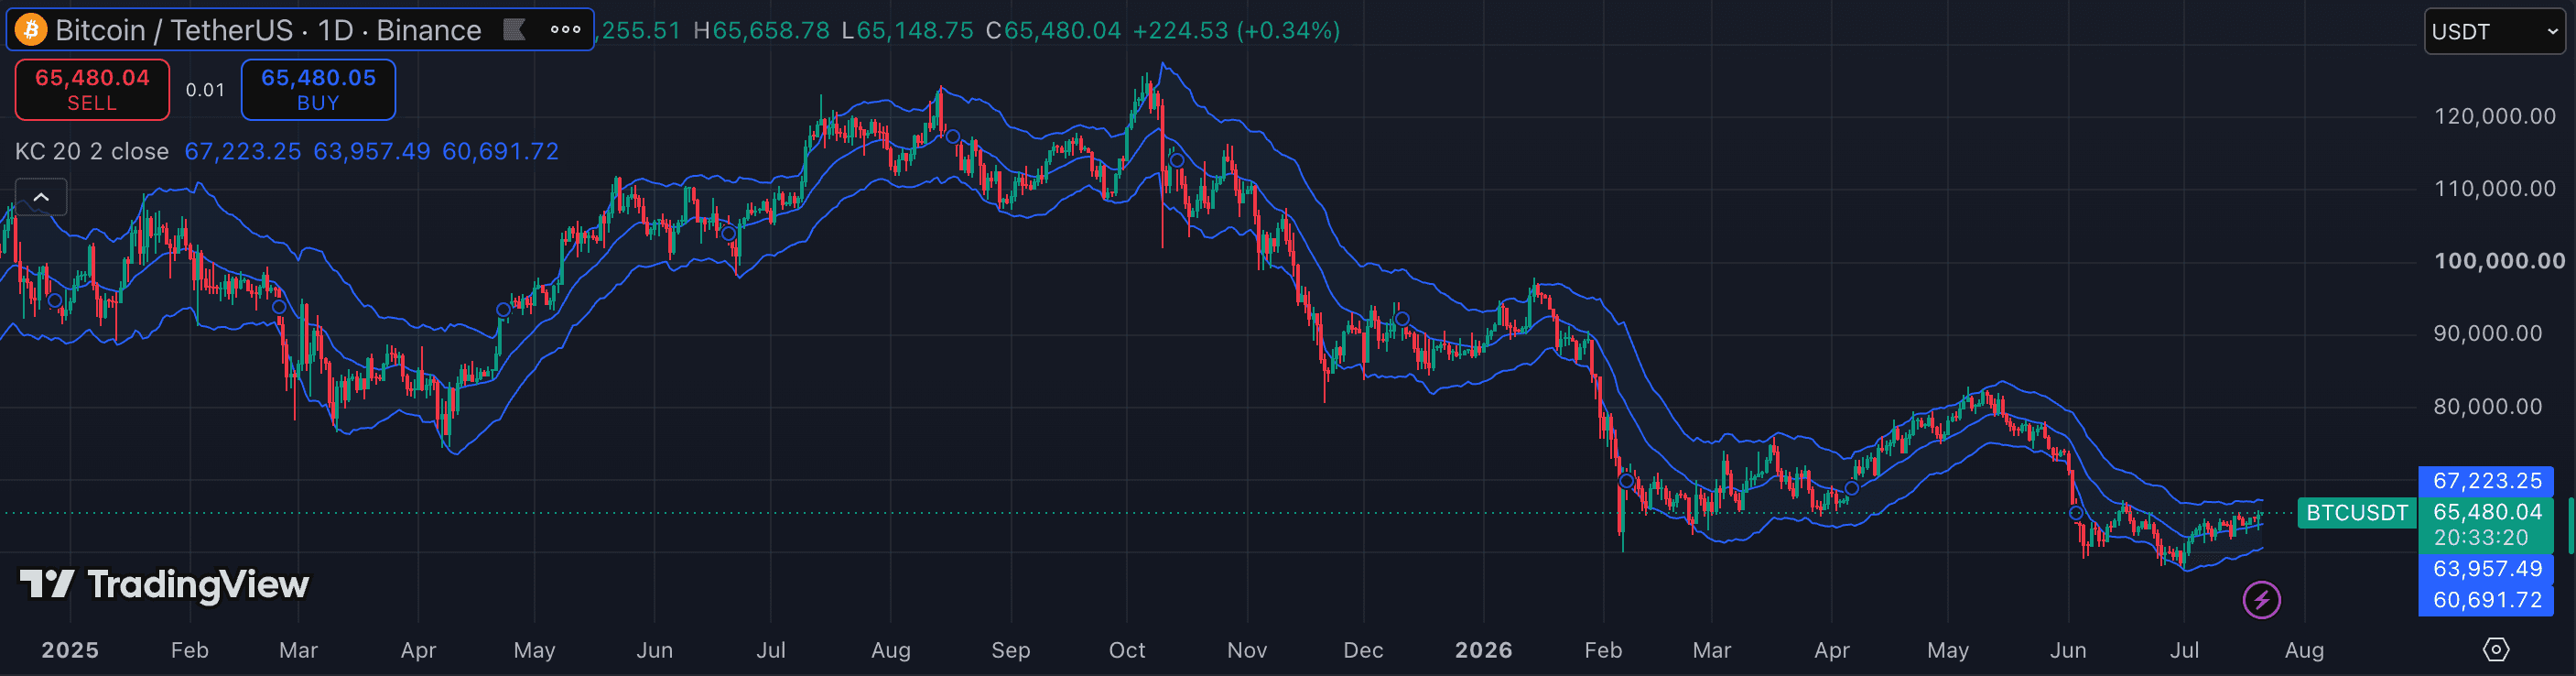
The attributes that matter.
| Attribute | ATR | Keltner Channels |
|---|---|---|
| Tool type | Single volatility measure | EMA-centred price envelope |
| Core calculation | Average true range, commonly over 14 bars | EMA ± a multiple of ATR |
| Output | One line in a separate pane | Upper, middle, and lower lines over price |
| Directional? | No — rising or falling volatility only | Not by itself — price position adds context |
| Typical timeframe | 15m · 1h · 4h · 1D | 1h · 4h · 1D |
| Primary job | Compare volatility and normalise distance | Visualise volatility around a trend baseline |
| Breakout role | Shows whether range is expanding or contracting | Supports channel-break and squeeze analysis |
| Main limitation | Provides no price level or direction | Band touches are not standalone signals |
Which should you choose?
ATR is the foundational measurement. It converts recent true ranges into a single value, making it useful for comparing current volatility with earlier periods and for expressing chart distances in volatility-adjusted terms. The line does not say whether price is moving up or down, and it does not create support, resistance, or an entry signal by itself.
Keltner Channels turn the same volatility concept into a chart overlay. The middle EMA supplies a smoothed trend reference, while the ATR multiple sets the distance of the outer bands. That layout makes expansion, contraction, and price location easier to scan, but the extra visual context can be misread: touching or crossing a band does not independently classify a breakout or reversal.
For learning volatility and building a transparent baseline, ATR is usually the better first choice because it exposes the underlying measurement used by Keltner Channels and many other tools. Choose Keltner Channels when the specific job is to place volatility around an EMA for channel, pullback, or squeeze analysis. Using both is often redundant unless the separate ATR pane answers a distinct measurement question.
- You want the simplest direction-neutral measure of current volatility
- You need to compare range conditions without adding another price overlay
- You want to understand the ATR input used by channels and trailing tools
- You want volatility bands displayed directly around price
- You use an EMA midline as trend and pullback context
- You compare Keltner Channels with Bollinger Bands for squeeze analysis
Other comparisons
Not investment advice. PineRadar is an editorial directory — links may be affiliate. Always test indicators on a demo account.