Moving AveragevsADX
Moving Averages and ADX are both trend tools, but they answer different questions. A Moving Average estimates direction and a dynamic reference level; ADX measures whether a trend has enough strength to distinguish it from chop. This comparison shows which tool works as the primary chart layer and which works best as a regime filter. Educational content only; not financial advice.
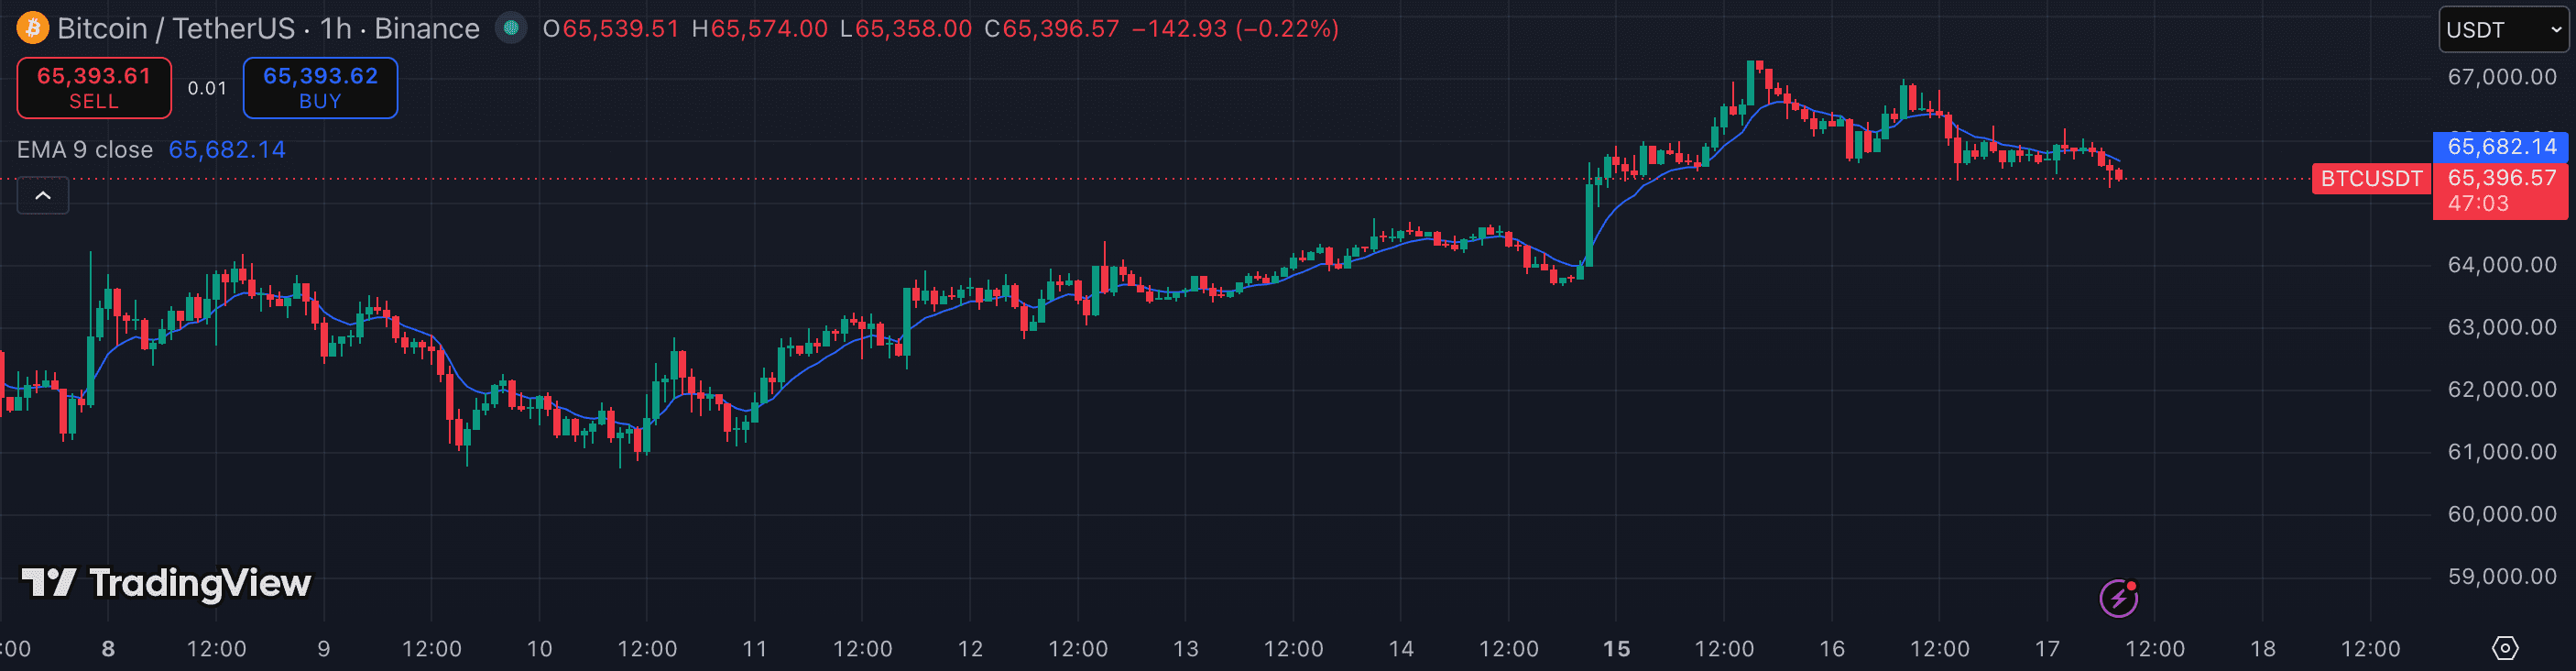
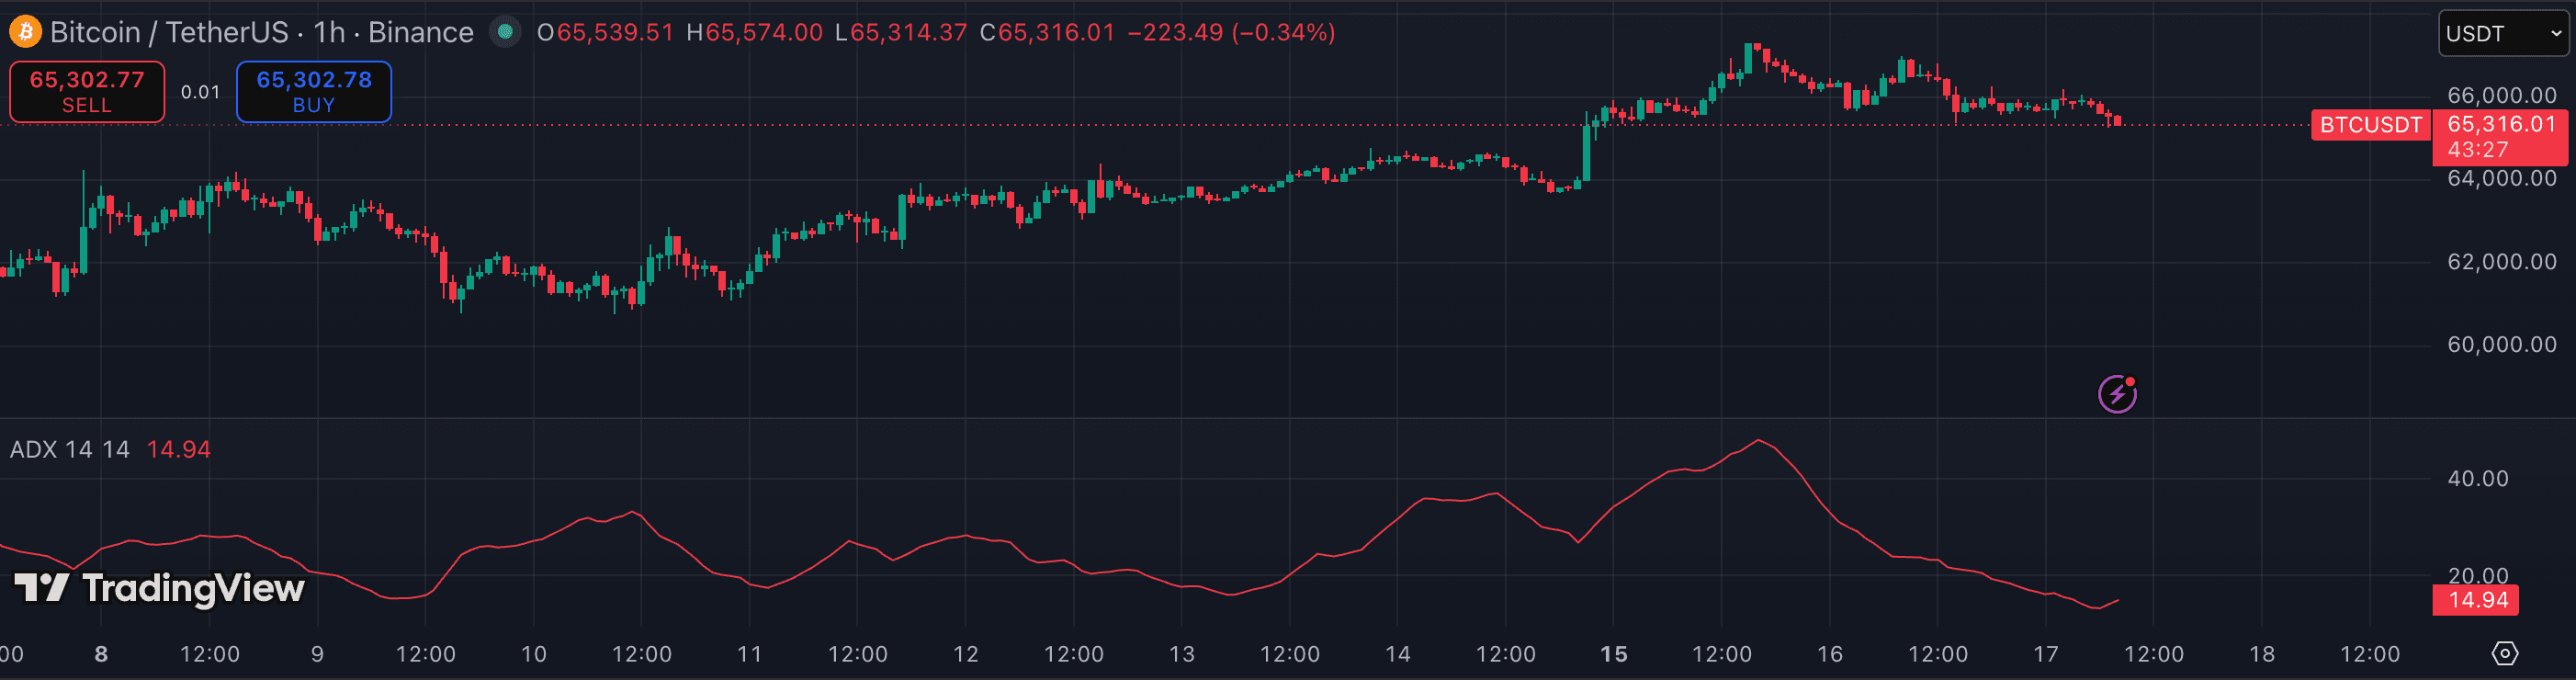
The attributes that matter.
| Attribute | Moving Average | ADX |
|---|---|---|
| Primary question | Which direction is the smoothed trend? | How strong is the current trend? |
| Output | One or more lines over price | ADX line, usually with +DI and −DI |
| Default period | Varies; 20, 50, and 200 are common | 14 |
| Directional? | Yes — slope and price position provide context | ADX alone: no; DI lines add directional context |
| Best timeframe | 15m · 1h · 4h · 1D | 1h · 4h · 1D |
| Range handling | Poor — repeated crosses and flat slopes | Useful — low readings flag weak or ranging conditions |
| Dynamic price level | Yes — often used as moving support/resistance context | No — oscillator pane only |
| Best for | Direction, smoothing, and pullback context | Filtering trend systems by regime strength |
Which should you choose?
A Moving Average is the more direct chart-reading tool. Its slope and price relationship provide a simple directional frame, while multiple lengths can separate short-, medium-, and long-term trend context. It is easy to understand and available on every timeframe, but it becomes unreliable in sideways conditions because price can cross the line repeatedly without a sustained trend.
ADX addresses that weakness rather than replacing the Moving Average. Level and slope say different things: an elevated ADX indicates that a strong directional regime is in place, while a rising ADX indicates that directional strength is building. A high but falling reading describes a trend that is still strong yet losing momentum, and a low reading suggests that a trend-following interpretation deserves less weight. ADX does not identify bullish or bearish direction by itself, and the +DI/−DI lines still need price context, so it is usually more useful as a filter than as the only indicator on a chart.
If you need one first trend tool, the Moving Average is usually the better starting point because it provides direction and a visible chart reference. Add ADX when repeated Moving Average crosses make it hard to distinguish a trend from a range. In a combined workflow, the Moving Average supplies direction while ADX describes the strength of that directional regime.
- You want a simple directional overlay that works across timeframes
- You use price relative to a line as trend and pullback context
- You are choosing a first trend indicator for a clean chart
- You already have a directional tool and need a trend-strength filter
- You want to identify low-strength conditions before trusting trend signals
- You are comfortable reading ADX separately from the +DI and −DI lines
Other comparisons
Not investment advice. PineRadar is an editorial directory — links may be affiliate. Always test indicators on a demo account.