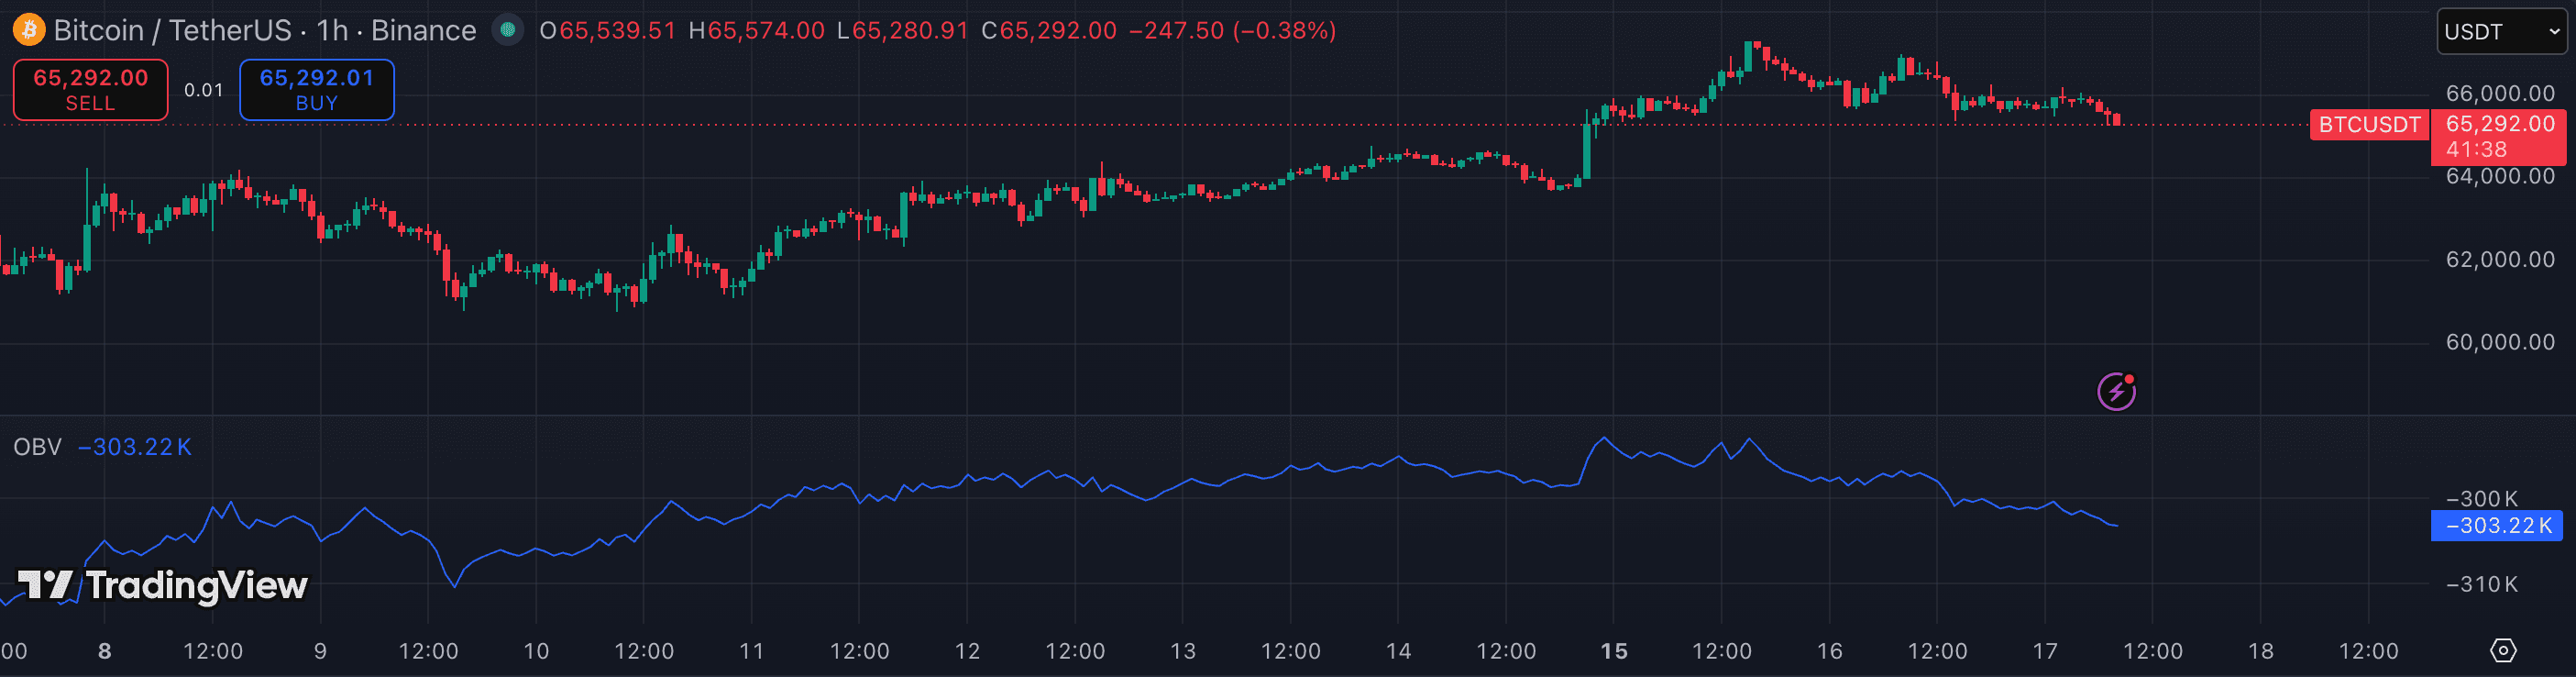
OBV (On-Balance Volume) adds the session's volume on up bars and subtracts it on down bars, producing a running cumulative line. The absolute value of that line is meaningless — what matters is its direction relative to price. When OBV and price move together, the trend has volume behind it. When they diverge, the move is losing participation. Here's how to read it and apply it to crypto.
1. Forget the absolute OBV value — read the slope
OBV's cumulative nature means its level depends entirely on where the calculation started. On TradingView this varies by chart load, so comparing OBV levels across different sessions or pairs is meaningless. The only thing that carries information is whether the line is rising, falling, or diverging from price.
Think of OBV as a flow indicator: a rising slope means the majority of volume is happening on up bars (buyers are more active); a falling slope means volume is concentrating on down bars (sellers dominate).
2. Use OBV to confirm breakouts
A price breakout above resistance is most reliable when OBV breaks above its own prior high at the same time — this shows that increased volume is driving the move, not price drifting higher on thin tape. An OBV that refuses to make a new high as price breaks out is a warning: the move may not have the participation to sustain it.
Apply the same logic on breakdowns: price breaking support with OBV making new lows is a confirmed breakdown. Price breaking support while OBV holds steady is a potential fakeout — the volume tells you sellers are not fully committed.
3. Hunt bearish and bullish divergence
Bearish divergence: price makes a new high but OBV makes a lower high — volume participation is declining as price rises. This signals the trend is attracting fewer buyers, and a reversal or consolidation is more likely than continuation.
Bullish divergence: price makes a new low but OBV makes a higher low — sellers are hitting the bid but cumulative volume flow is not confirming the weakness. This often precedes a bounce or trend reversal.
Divergences on 4h and 1D charts on BTC and ETH are more reliable than on lower timeframes, where random volume spikes create misleading OBV noise.
4. Add a moving average to OBV for trend clarity
OBV can be jagged on lower timeframes. A practical technique: apply a 20-period EMA directly to the OBV line. When OBV is above its own EMA and both are rising, volume flow is bullish. When OBV crosses below its EMA, the trend in volume flow is shifting bearish.
In TradingView you can apply a moving average to the OBV indicator output through the indicator's settings panel. This smoothing makes divergences cleaner and the read more consistent.
5. Combine with price structure for entries
OBV is a confirmation tool, not an entry trigger. The practical workflow: identify a key price level (support, resistance, Volume Profile POC, VWAP reclaim) → check whether OBV is confirming or diverging at that level → take the trade only when both align. A price breakdown with OBV diverging is a reason to wait — the divergence signals sellers are not fully in control yet.
- Comparing absolute OBV levels between charts or sessions — the value resets differently each load; only slope and divergence carry information.
- Using OBV on illiquid low-cap altcoins where volume data is unreliable — OBV is most useful on assets with genuine volume reporting such as BTC, ETH, and SOL.
- Treating OBV divergence as an immediate entry signal — divergence can persist for many bars before resolving; wait for price structure confirmation before acting.
- Applying OBV on 1m or 5m charts, where single large candles create OBV spikes that distort the slope without being structurally meaningful.
- Ignoring OBV when confirming breakouts and only using it for divergence — the confirmation role (breakout accompanied by rising OBV) is equally important.