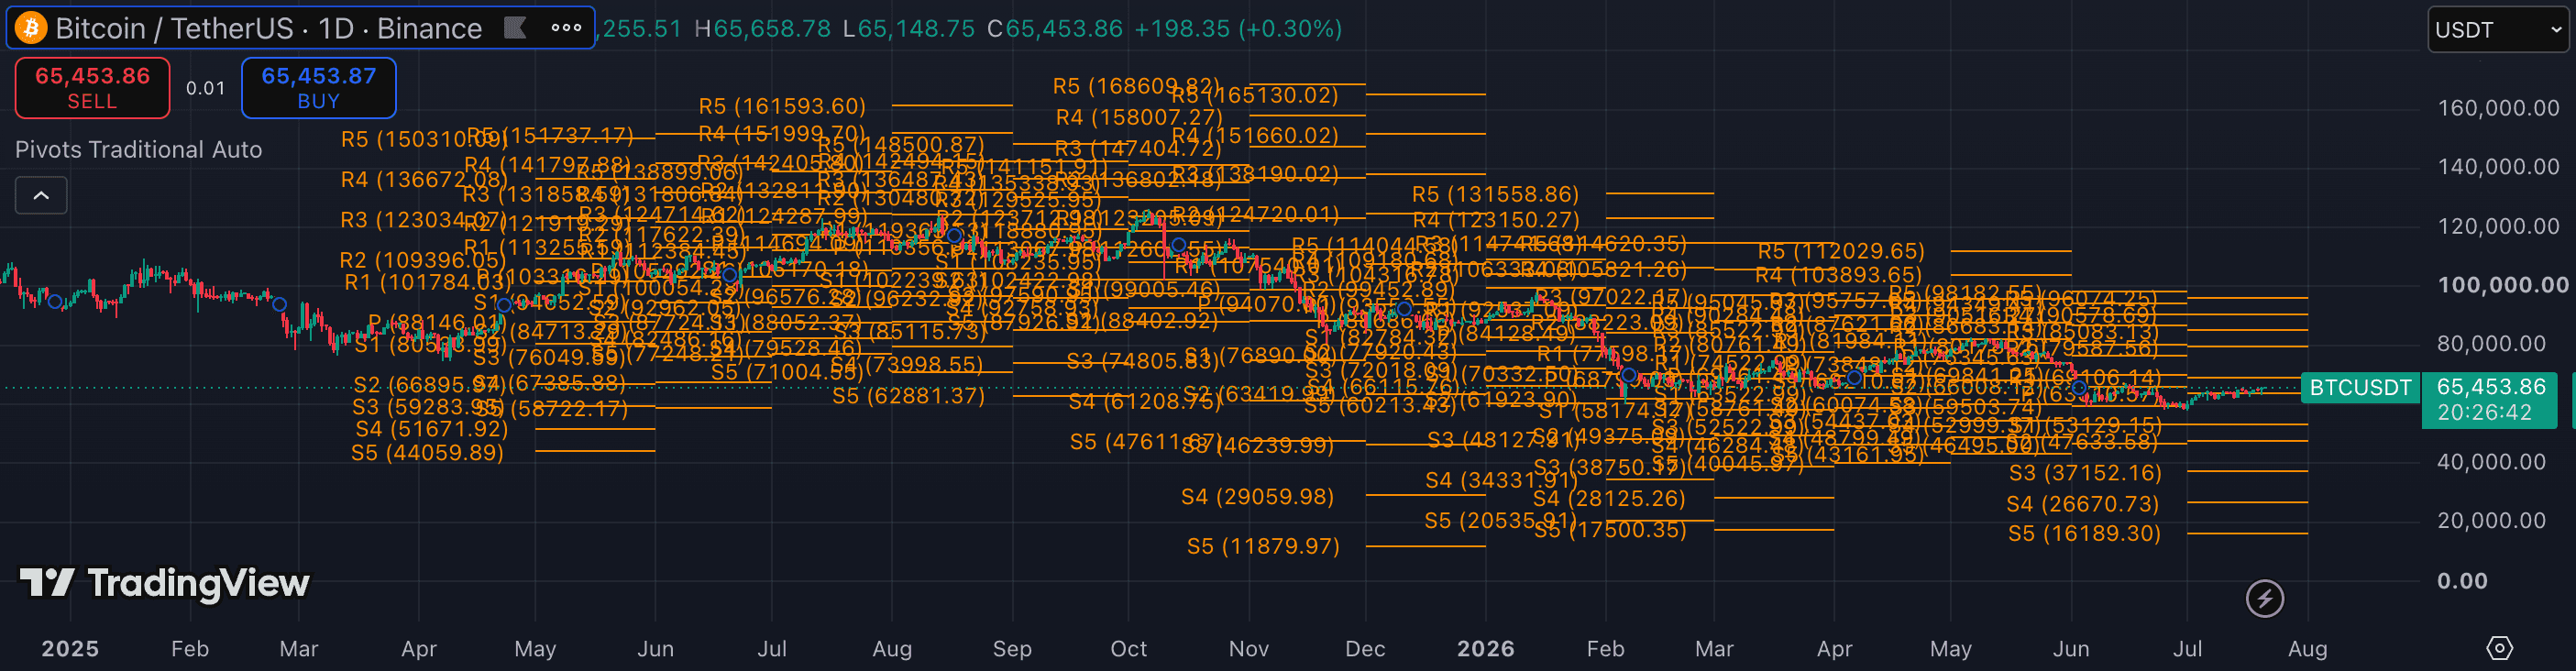
Pivot Points calculate a central pivot and up to three support (S1–S3) and resistance (R1–R3) levels from the prior session's high, low, and close. On crypto, that session is typically the daily close. Because the levels are calculated before the trading day begins, they give you a forward-looking price map that many participants are watching simultaneously — which is part of why they tend to hold.
1. Add the built-in Pivot Points indicator
Search 'Pivot Points Standard' in TradingView's indicator library. It's built-in and free. Set the anchor period to 'Day' for intraday trading — this calculates new levels each day from the prior daily candle.
The calculation type options are Traditional, Fibonacci, Camarilla, and Woodie. Start with Traditional — it is the most widely used on crypto and the self-fulfilling nature of support/resistance depends on shared reference.
2. Use the central pivot as your session bias filter
Price above the central pivot (PP) at the open favors long setups for the session. Price below it favors shorts. This is the simplest and most durable use of pivot points — a directional filter before you look at any other signal.
A strong trend day often starts by sweeping to the central pivot from one side and then continuing in the trend direction. Watch how price reacts at PP in the first hour.
3. Trade S1 and R1 as primary targets
R1 is the first meaningful resistance — in a trend day, R1 is where many traders take partial profits and where counter-trend traders attempt fades. S1 mirrors this on the downside.
R2 and R3 are extension targets for high-momentum or news-driven moves. They are not routine targets — treat them as objectives only when the session already has strong directional follow-through past R1.
4. Combine with a momentum indicator
Pivot Points are purely mechanical S/R — they have no momentum component. Pair them with RSI or MACD to decide whether a level is likely to hold or break. A test of R1 with RSI already in overbought territory on the 15m chart is a weaker long setup than the same test with RSI mid-range and rising.
Volume confirmation also matters: a breakout above R1 on clearly above-average volume has a higher continuation rate than a low-volume creep through the level.
- Trading every pivot level as if it must reverse price — pivot levels are reference zones, not buy/sell orders.
- Using Camarilla or Woodie pivots without understanding how they differ — each type places levels at different distances; mixing them with Traditional rules causes confusion.
- Ignoring whether price has already swept a level earlier in the session — a level that's been tested and held once is different from a fresh test.
- Overlapping too many pivot types on the same chart — choose one calculation type and anchor period per setup.
- Applying daily pivots to higher-timeframe (swing) analysis where weekly or monthly pivots are more appropriate.