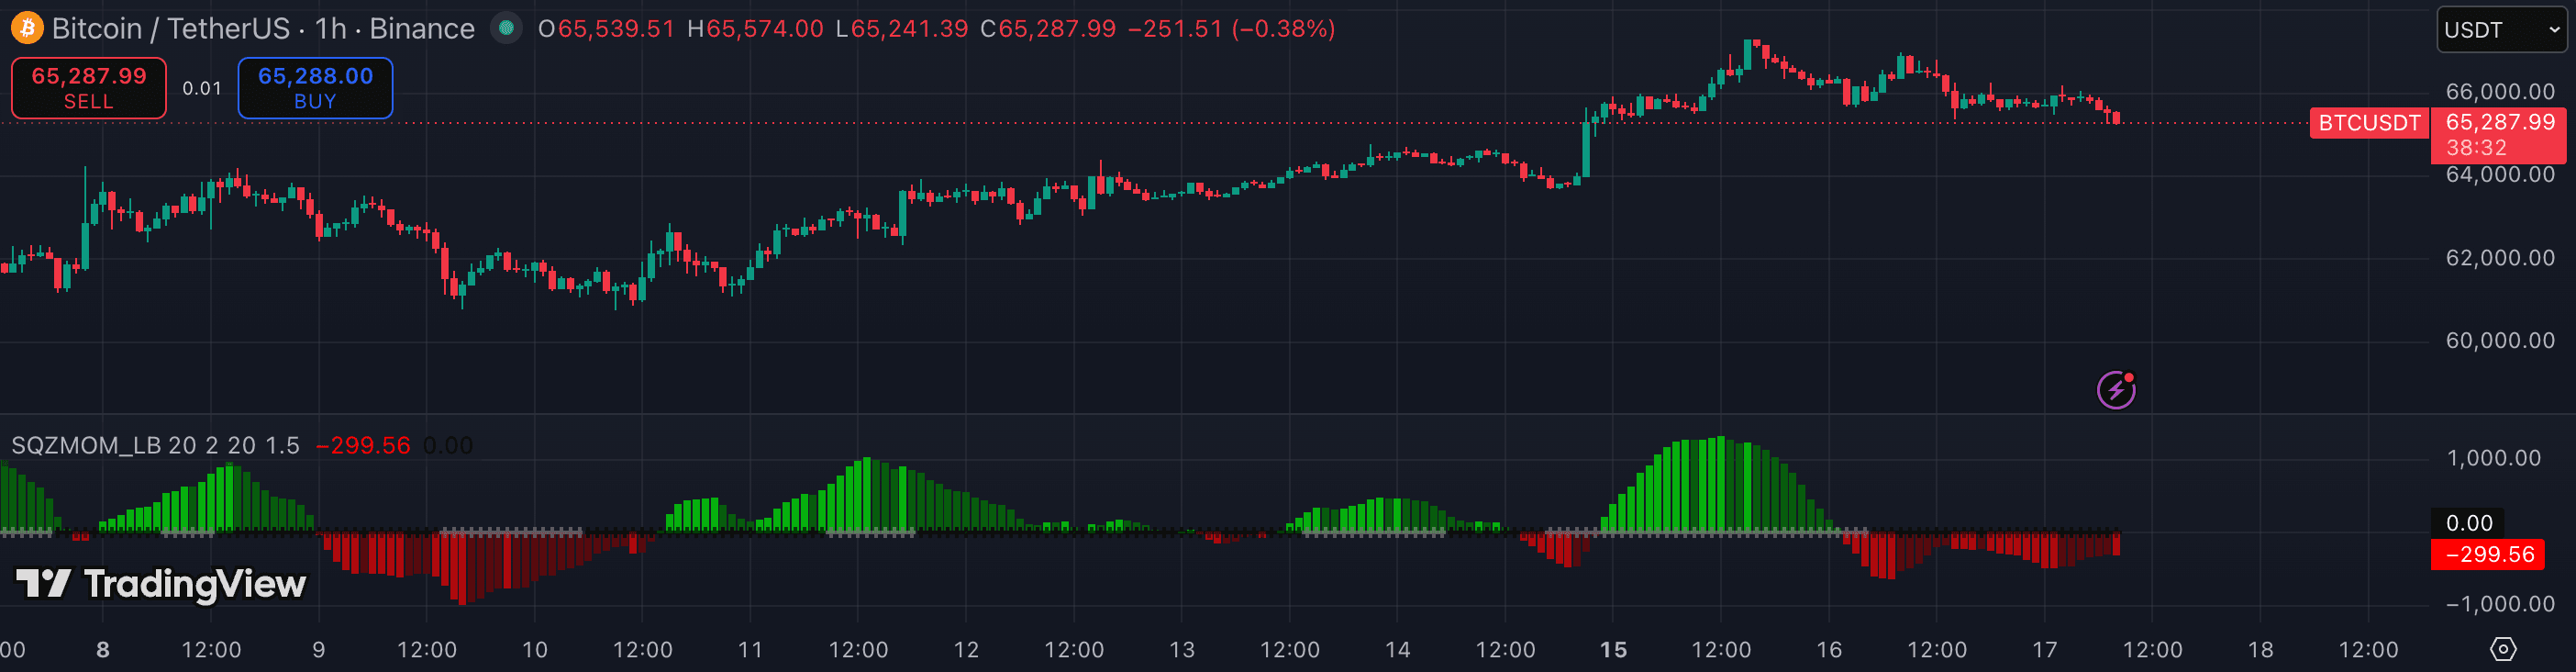
Squeeze Momentum (by LazyBear) combines a Bollinger Band / Keltner Channel squeeze filter with a momentum histogram. The squeeze itself tells you when the market is coiling; the histogram direction tells you which way it may release. The default settings work reasonably well, but small adjustments can make a real difference on volatile crypto pairs.
1. Understand the two signals before touching any number
The dots on the zero line are the squeeze indicator. Grey/black dots = squeeze is active (Bollinger Bands inside Keltner Channels). Green dots = squeeze has fired — price is expanding out of compression.
The histogram bars are momentum direction. Rising green bars = bullish momentum building. Falling red bars = bearish momentum building. Colour changes within the same direction are secondary — the bar turning a lighter shade does not mean reverse.
2. Set the BB / KC lengths to match your timeframe
The default is BB length 20 / Keltner length 20. On higher timeframes (4h, 1D) this is fine. On 1h or 15m crypto, many traders shorten both to 14 to make the squeeze fire a little earlier and avoid overshooting the release.
Keep BB and KC lengths equal — mismatching them changes the squeeze threshold in ways that are hard to interpret and rarely improve results.
3. Adjust the BB multiplier for crypto volatility
The BB multiplier defaults to 2.0. On BTC and ETH on 1h–4h, 2.0 is fine. On highly volatile altcoins, bumping to 2.25 reduces the number of spurious squeezes triggered by normal noise — you get fewer setups but they tend to be cleaner.
Do not lower the multiplier below 1.75; you'll get so many squeeze signals that the concept loses meaning.
4. Trade the momentum histogram, not just the squeeze fire
The squeeze firing (dot turning green) is only the alert. Wait for the histogram to commit: two or more consecutive bars in the same direction and colour. Entering on the very first green dot when the histogram is still mixed or flat often means catching the failed breakout.
Best entries: histogram is already making higher highs (bullish) or lower lows (bearish) when the squeeze fires. That alignment of coiling + committed momentum is the highest-probability setup.
- Entering the moment the squeeze dot turns green without waiting for histogram direction to confirm — many squeezes resolve sideways.
- Reading histogram colour changes (light green vs dark green) as reversal signals — they indicate momentum slowing, not reversing.
- Mismatching BB and KC lengths, which breaks the mathematical relationship the squeeze is built on.
- Stacking Squeeze Momentum with other momentum oscillators (RSI, MACD) and getting conflicting reads — pair it with a trend tool or structure level instead.