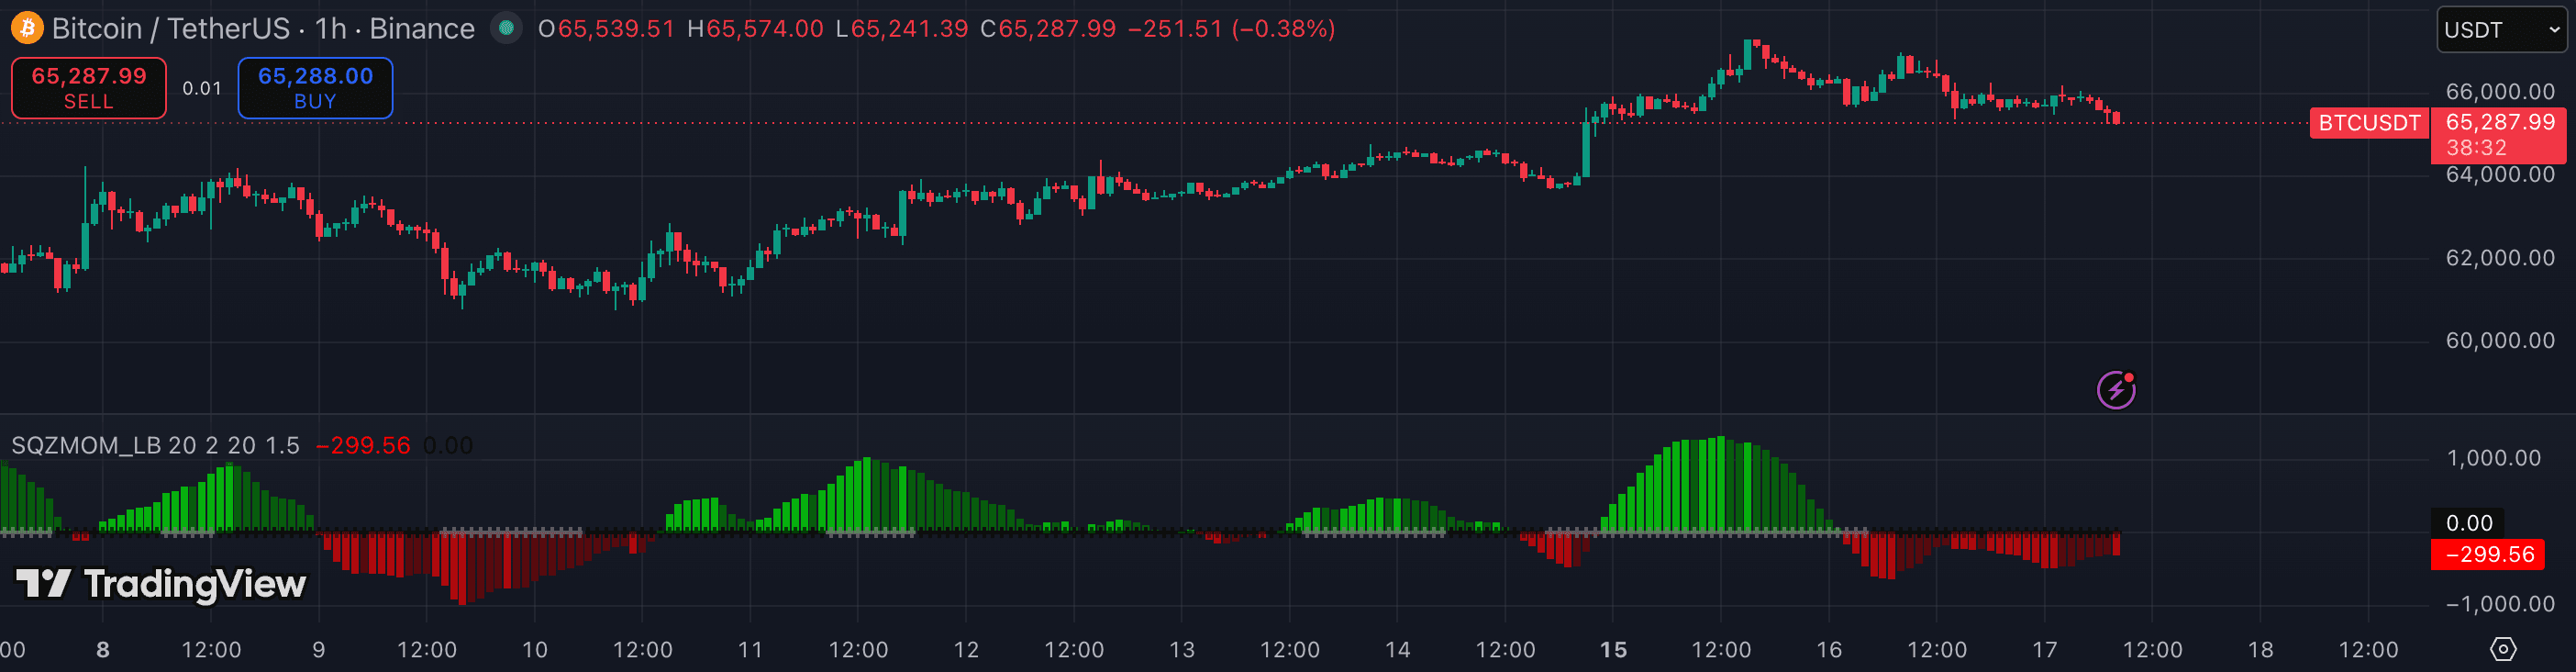
Squeeze Momentum (LazyBear's adaptation of the TTM Squeeze) is one of the cleanest breakout-timing tools available on TradingView. It does two jobs: it identifies when the market is compressing into a coil, and it tells you which way momentum is building inside that coil before price confirms the direction. This guide focuses specifically on applying it as a breakout system — how to set up, enter, and manage the resulting move rather than just reading the indicator in isolation.
1. Identify a valid compression setup
A breakout trade from Squeeze Momentum begins with the squeeze itself — a sustained run of red dots, meaning Bollinger Bands are contracting inside the Keltner Channels. A quality compression setup has at least five to ten consecutive red dots on the timeframe you're trading. Fewer than five bars suggests the coil hasn't built meaningful energy.
Validate the compression visually on the price chart: look for a narrowing range, lower highs and higher lows forming a tightening structure, or sideways consolidation near a key level such as a VWAP anchor, Volume Profile POC, or a prior support/resistance zone. Compression near key levels tends to produce higher-conviction breaks.
2. Watch the histogram while dots are still red
The momentum histogram is calculated inside the squeeze — it doesn't wait for the dots to turn green. While dots are still red, watch which direction the histogram bars are growing. Positive and growing means buying pressure is building inside the coil. Negative and growing means selling pressure is building.
This directional lean before the fire is the edge: you know which side is more probable before price confirms. A histogram that is climbing through positive territory while dots remain red gives you a setup bias — you're looking for a long breakout. A histogram falling through negative territory tells you to watch for a short break.
3. Enter when the squeeze fires with histogram alignment
The entry trigger is the transition from red dots to green dots — the moment Bollinger Bands expand back outside the Keltner Channel. The ideal entry is the first or second green dot bar where the histogram is clearly aligned with your directional lean from step two.
Wait for a candle close before acting. Intrabar green dot transitions can revert — a close confirms the state. The entry is on the open of the candle following the first confirmed green dot close, with the histogram still positive (for longs) or negative (for shorts).
4. Place the stop below the compression structure
For breakout trades, the stop belongs at the far side of the compression structure — not at the most recent candle low. If price consolidated between 42,000 and 44,000 before breaking up, the stop goes below 42,000, not just below the entry candle. The whole coil is the trade thesis; if price re-enters the full range, the setup has failed.
Using ATR to size the stop is also valid: place it 1.5–2 ATR below the lowest bar of the compression range for longs, or above the highest bar for shorts. This approach accounts for the volatility level of the asset and timeframe you're trading.
5. Manage the trade with the histogram
Breakout trades powered by Squeeze Momentum tend to run in bursts. While the histogram bars are growing in your direction, the move is accelerating — hold the position. When the histogram begins shrinking (shorter bars in the same direction), momentum is fading and the move is likely entering its final stage.
A practical approach: take partial profit (50%) when the histogram shows the first two consecutive shrinking bars, and move the stop to breakeven or a structure level. Hold the remainder until the histogram crosses zero or price hits a significant resistance or support level. This captures the core of the breakout without holding through a full reversal.
- Entering during the red-dot phase before the squeeze fires — price can stay compressed for many more bars, and there is no structural entry logic until the direction confirms.
- Ignoring the histogram direction and entering on any green dot — a green dot with a flat or opposing histogram has no directional edge.
- Setting the stop too tight inside the compression range — if price re-enters the consolidation, the thesis is broken; the stop should sit below the entire range.
- Trading low-timeframe squeezes into obvious resistance or VWAP levels — the location matters as much as the squeeze signal.
- Holding through a histogram that has already crossed zero — the momentum signal that validated the trade is now reversed; there is no reason to stay in.