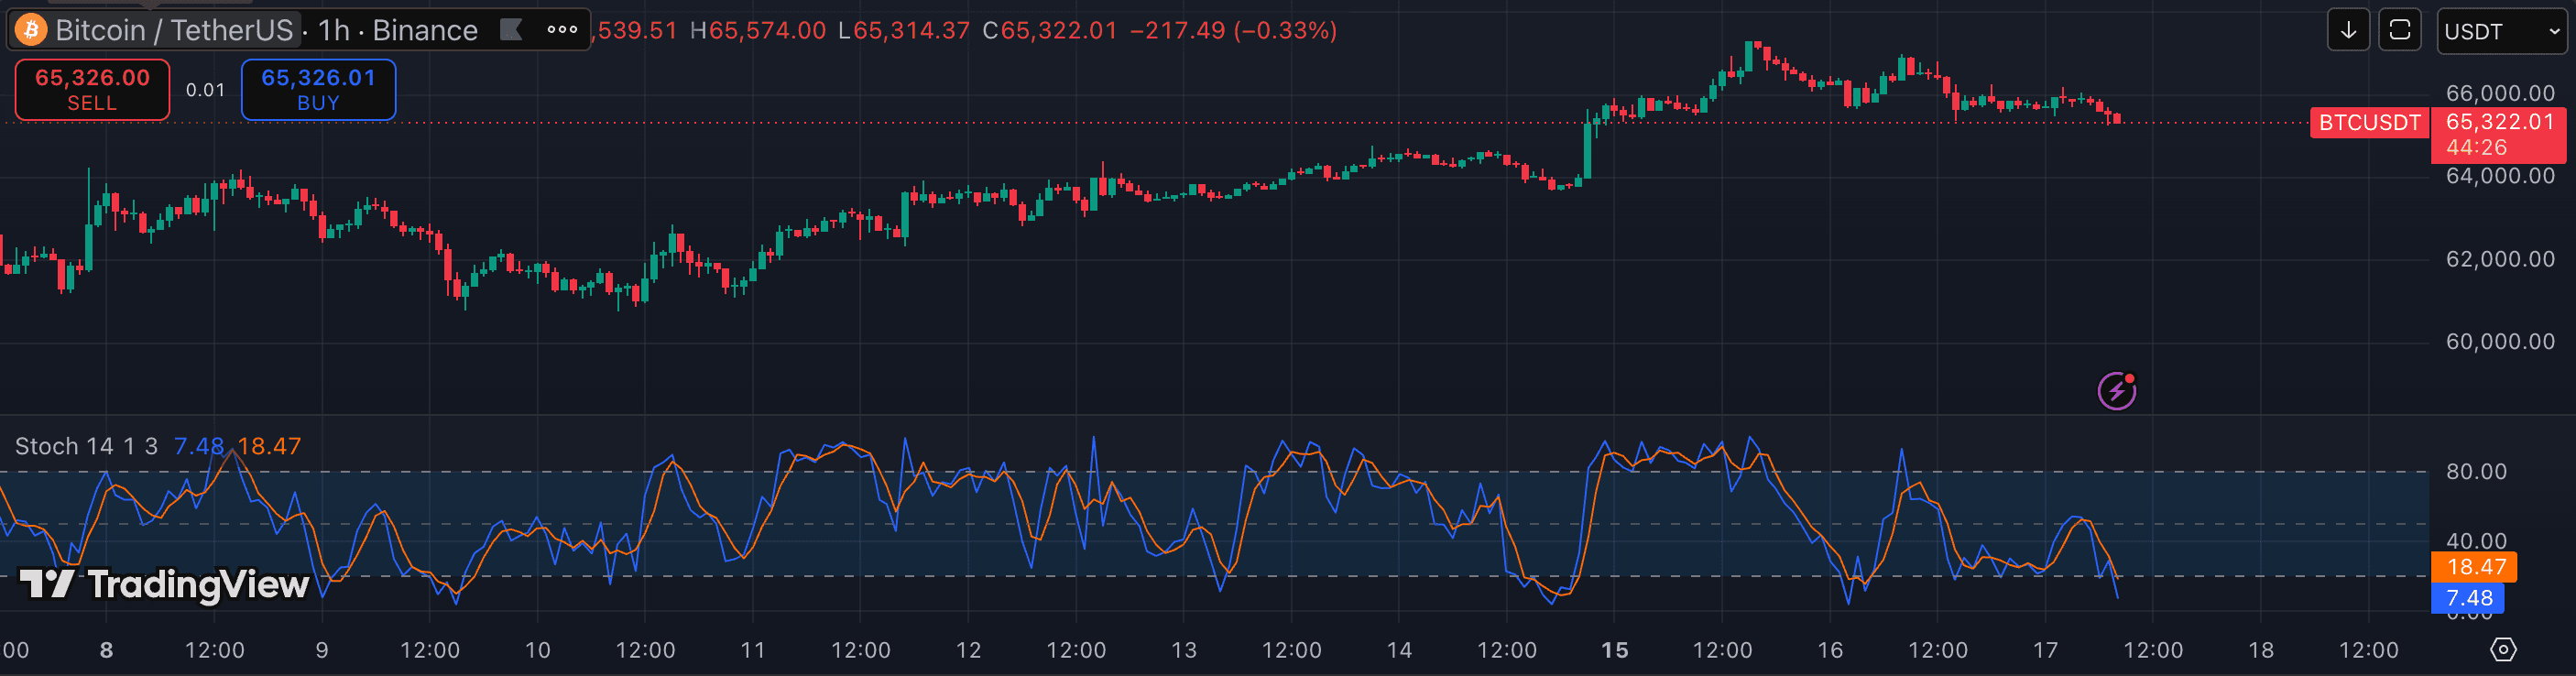
The Stochastic oscillator compares the latest closing price to its high-low range over a lookback period (default 14, 3, 3). It plots two lines — %K and %D — and fires signals when they cross in the overbought (above 80) or oversold (below 20) zone. It is faster and noisier than RSI, which makes it useful in defined ranges and for timing quick turns on 5m–15m charts. The trap is running it in a trending market, where it fires reversal signal after reversal signal against the move. Here's how to use it correctly.
1. Understand the %K and %D lines
%K is the raw Stochastic line — it measures where the close sits within the lookback range on a 0–100 scale. A reading of 80 means the close is near the top of the recent range; 20 means it's near the bottom. The %D line is a smoothed version of %K (usually a 3-period MA). When %K crosses above %D, momentum is turning up; when it crosses below, it's turning down.
The crossing event is the signal. A cross near an extreme (near 20 or near 80) carries more weight than a mid-range cross (around 40–60). Mid-range crosses happen constantly and carry almost no information.
2. Know which market environment Stochastic belongs in
Stochastic was designed for mean reversion in a range — it assumes price is oscillating between a high and a low, and flags when it reaches an extreme. In a trending market, price moves one-directionally and Stochastic stays pinned in overbought or oversold territory, firing reversal signals that are wrong one after another.
Before using Stochastic, ask: is the market ranging or trending? A flat, horizontal chart with clear top and bottom bounds = Stochastic territory. A directional move with a rising EMA and ADX above 25 = step away from Stochastic. This one check eliminates the majority of bad Stochastic trades.
3. Trade the cross at an extreme
The highest-quality Stochastic signal is a %K/%D cross near the overbought or oversold extreme. For a long: %K falls below 20 (oversold), then %K crosses back above %D while both lines are still below 20. For a short: %K rises above 80, then crosses back below %D while both are still above 80.
Require the cross to happen within the extreme zone, not just near it. A cross at 35 on the way down is not an oversold signal — wait for 20 or below. That discipline alone cuts most false signals.
4. Combine with a range boundary or support/resistance level
Stochastic gives you timing; a price level gives you location. The most reliable Stochastic trade pairs an oversold cross with price simultaneously sitting at a clear support level — a prior swing low, a Volume Profile HVN, a VWAP reclaim, or a key moving average. The indicator signals exhaustion; the level confirms there is a structural reason for price to stop there.
Without a price level, a Stochastic oversold reading just tells you the close is near the recent low — it could be a real low or just the beginning of a larger move down. The level is what provides the edge.
5. Use it on 5m–1h for scalp timing, filter with a higher timeframe
Stochastic works best on 5m–15m charts for tight scalp timing within a range, or on 1h as a short-term entry timer when you have a confirmed higher-timeframe bias. On 4h and above, Stochastic's range-reversion logic breaks down because each bar represents significant price action and instruments rarely range neatly at that scale.
If you're trading off a 5m Stochastic, confirm the 1h or 4h chart is in a ranging regime (flat EMA, low ADX) before trading the 5m signals. A ranging environment on the higher timeframe dramatically increases the hit rate of your lower-timeframe Stochastic entries.
- Shorting because Stochastic is overbought in a strong trend — a rising market can stay overbought for days without reversing.
- Trading mid-range %K/%D crosses — these happen constantly and are the source of most Stochastic false signals.
- Using Stochastic on trending timeframes (4h+) where the oscillator stays pinned in one zone rather than oscillating cleanly.
- Taking a Stochastic signal without a price-level confirmation — the oscillator alone doesn't tell you where price will actually stop.
- Confusing Stochastic with Stochastic RSI — they are different calculations; Stochastic RSI is faster and more sensitive, designed as an entry timer rather than a range oscillator.