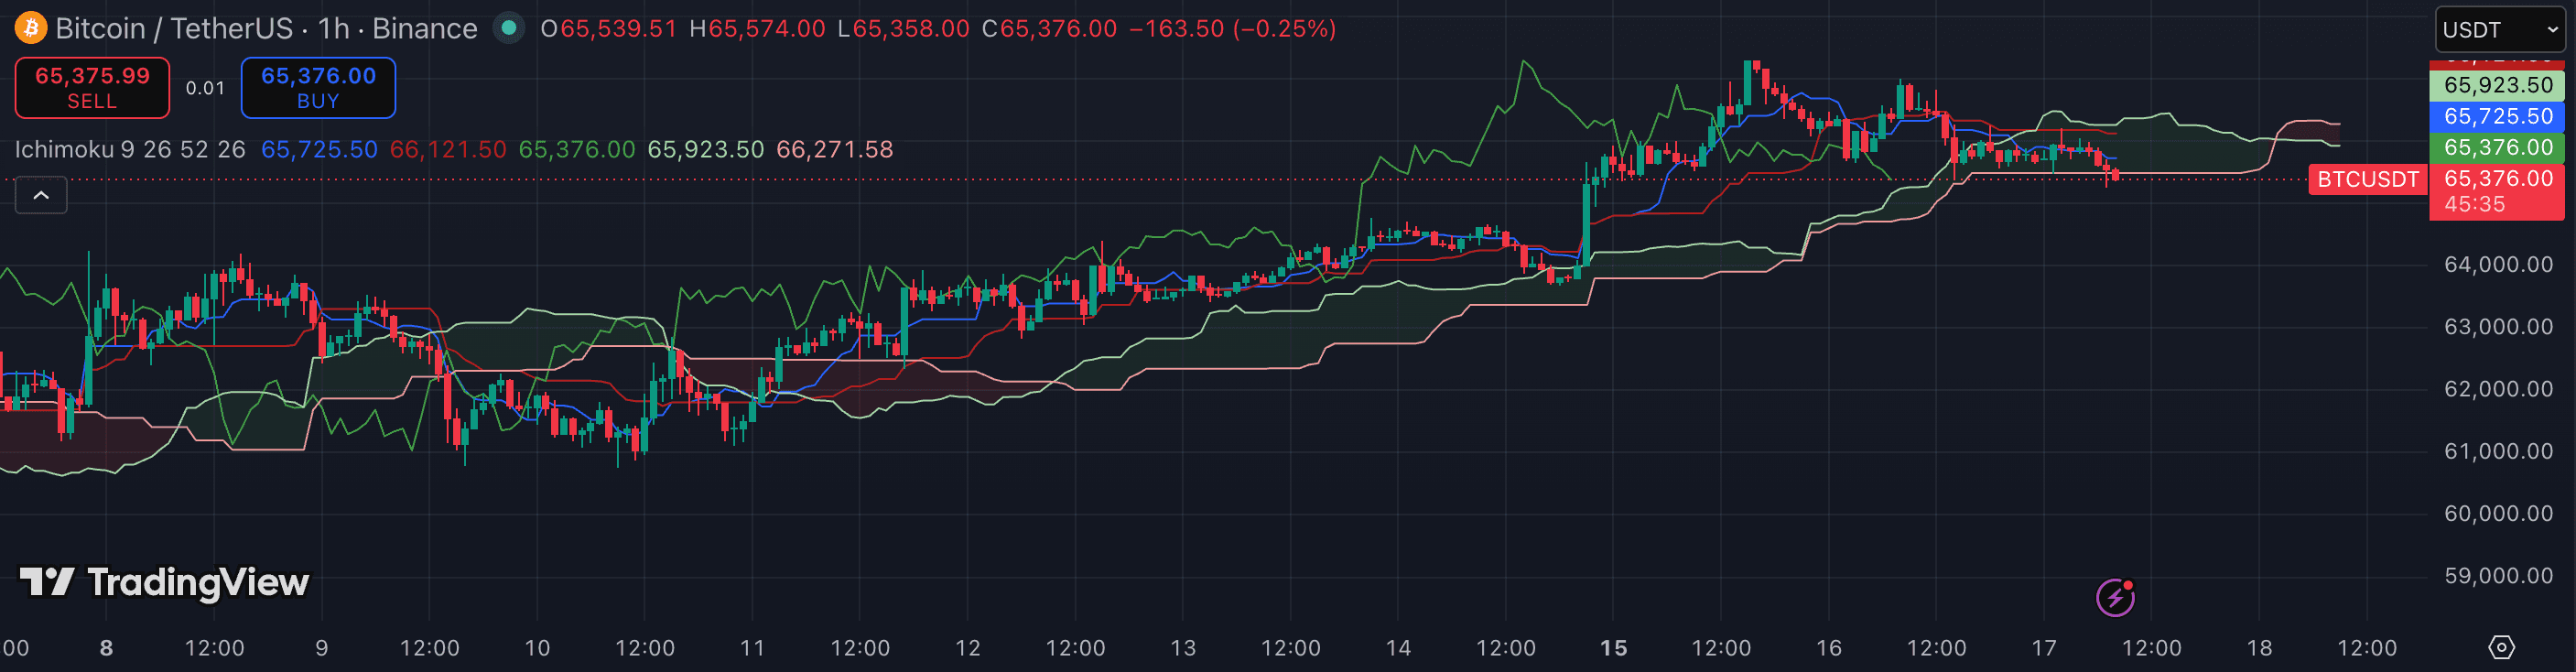
Ichimoku Kinko Hyo bundles five lines and a shaded cloud into a single overlay that shows trend bias, momentum, and future support/resistance simultaneously. It looks overwhelming at first — most traders either dismiss it as too complex or apply it with default settings tuned for 1950s Japanese equities. This guide focuses on the three reads that carry the most weight in crypto and shows you how to use them as a practical decision framework.
1. Start with the Cloud for directional bias
The Kumo (cloud) is the most important element. Price above the cloud is bullish bias; below is bearish; inside the cloud is no-man's-land where signals are weak and conflicting. Make this your first question on any chart before looking at anything else.
The cloud's colour also matters: a green cloud (Senkou Span A above Senkou Span B) signals a bullish structure; a red cloud signals bearish. Trading with cloud colour in your favour adds one more layer of confluence.
2. Use the Tenkan/Kijun cross for momentum
The Tenkan-sen (9-period midpoint) and Kijun-sen (26-period midpoint) function like a fast/slow MA pair. When Tenkan crosses above Kijun above the cloud, that is the system's strongest bullish signal. A cross below the cloud is weak; a cross inside the cloud is neutral and best ignored.
For crypto swing trading, these crosses on 4h or 1D filter well. On lower timeframes they generate too many crosses in ranging conditions to be reliable.
3. Read the Cloud ahead as forward S/R
Unlike every other indicator, Ichimoku projects the cloud 26 bars into the future. That future cloud is where price is likely to find support or resistance on a pullback. A thick cloud ahead means strong structural resistance or support; a thin cloud means price will move through the zone more easily.
Before entering a trend trade, check what lies ahead in the cloud. If price is heading into a thick cloud of the opposite colour, that zone will absorb momentum. If the cloud ahead is thin or the same colour as your bias, the path of least resistance is cleaner.
4. Check the Chikou Span for confirmation
The Chikou Span (Lagging Span) is the current close plotted 26 bars back. When the Chikou Span is above the price action from 26 bars ago, current momentum is stronger than it was at that historical point — a bullish confirmation. When it is below, the reverse.
This element is frequently skipped, but it functions as a useful final filter: only take TK crosses where the Chikou Span is also on the correct side of historical price.
5. Adjust settings for crypto timeframes
The classic Ichimoku settings (9/26/52) were designed for a six-day Japanese trading week, where 26 days represents a calendar month. On 24/7 crypto, some traders shift to 10/30/60 to preserve the proportional relationship, or use the defaults on 4h and above where the practical difference is small.
Avoid using Ichimoku on timeframes below 1h — the lines chop frequently and the cloud loses its structural meaning in market-microstructure noise.
- Trading signals inside the cloud — Ichimoku explicitly treats the cloud as a no-man's-land; signals there have the weakest follow-through.
- Using default 9/26/52 settings on 1m–15m charts, where the lines provide no structural meaning and generate constant whipsaw.
- Treating every TK cross as an entry regardless of where it occurs relative to the cloud — only above-cloud crosses in a bullish structure carry real weight.
- Ignoring the future cloud projection, which is one of the system's distinctive edges and maps where structural zones lie ahead.
- Stacking Ichimoku with several other trend indicators — the system is designed to be self-contained; adding MAs on top largely duplicates its information.