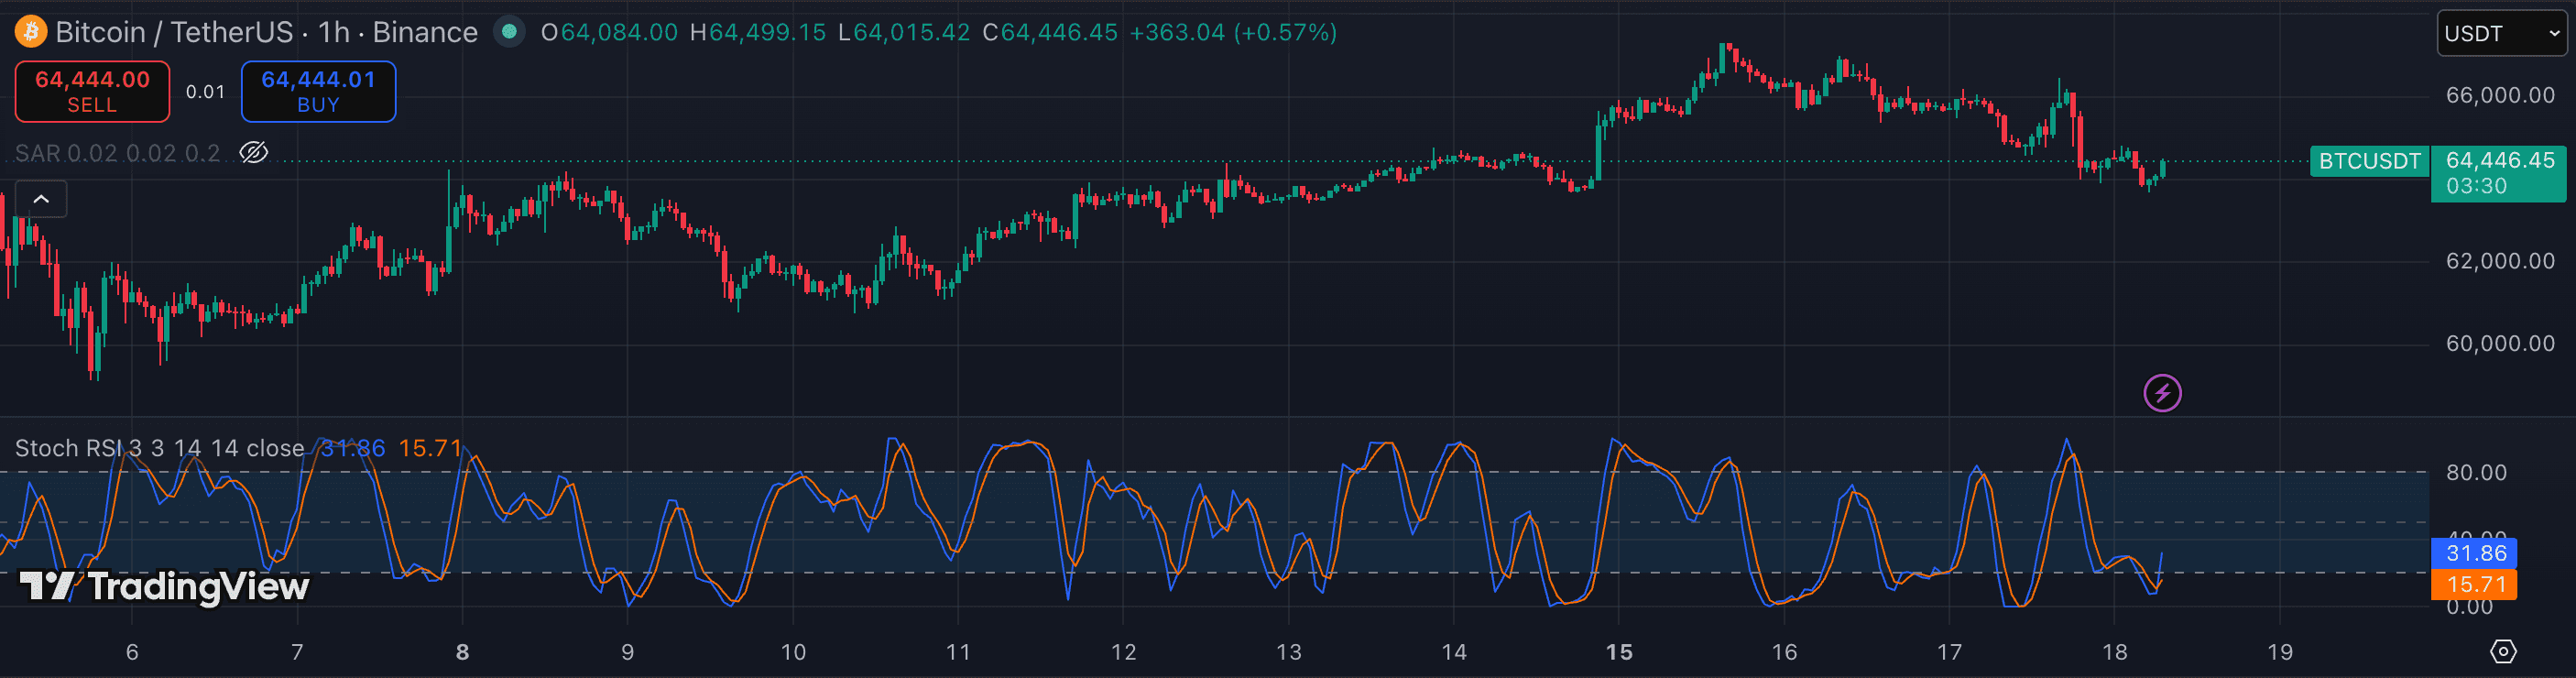
Stochastic RSI applies the Stochastic formula to RSI values instead of price, producing an oscillator that reaches overbought and oversold levels far more often than plain RSI. That sensitivity is its edge and its trap: used in the right context, it gives you a fast pullback-entry trigger; used in isolation, it fires signals constantly in ranging markets and keeps you on the wrong side of strong trends. This guide shows you how to filter it correctly.
1. Understand what it's measuring — and why it fires so often
Stochastic RSI takes the RSI value (already a derived measure of price momentum) and applies a Stochastic normalization — it asks where today's RSI value sits within its own recent range. The result is doubly smoothed and doubly sensitive: if RSI has been elevated for a few bars and then dips slightly, Stoch RSI can plunge to oversold even though the underlying trend hasn't changed.
This is by design. Stochastic RSI's high sensitivity makes it useful for timing entries within a trend; it is not designed to call reversals in the same way plain RSI is. If you're using it to predict tops and bottoms, you're using the wrong tool.
2. Establish a higher-timeframe bias first
Stochastic RSI should never be the first indicator you look at on a chart. Establish the trend direction on a higher timeframe — using Supertrend on 4h, or the MACD zero line, or simply whether price is above or below the 50 EMA on 1h — before touching Stochastic RSI on your entry timeframe.
Then apply a single directional rule: in a bullish trend, only trade Stoch RSI signals when it sweeps up from oversold (the K line crosses above D near the 0–20 zone). In a bearish trend, only trade signals when it sweeps down from overbought. This one filter eliminates most of the constant false signals the indicator produces in both directions.
3. Look for the %K / %D cross near extremes
The trigger signal is the %K line crossing above %D (the signal line) in the oversold zone (0–20) for a long, or crossing below %D in the overbought zone (80–100) for a short. A cross mid-range (40–60) is noise — many scripts paint crosses in the middle of the scale constantly and they carry almost no information.
Wait for the cross to happen near an extreme, then confirm with a candle reaction on the price chart (rejection wick, engulfing bar, or a bar that respects a key level). The Stoch RSI cross is the timing signal; the candle confirmation is the actual entry trigger.
4. Use it on your entry timeframe with a structure-level anchor
Stochastic RSI is an entry-timing tool, not a level-picking tool. Combine it with a price level that gives you a location — a Volume Profile POC, a VWAP, a key support/resistance zone, or an EMA. The setup is: level gives you 'where to trade'; Stoch RSI gives you 'when to enter at that level'.
A common application: price has pulled back to the 21 EMA on the 15m chart. Watch Stoch RSI on the 15m. When the K line sweeps from oversold and crosses D, enter long with a stop below the EMA. The indicator gave you the timing; the EMA gave you the location.
5. Manage exits — Stoch RSI overbought is not a sell signal in a trend
In a trending market, Stochastic RSI can stay pinned in overbought territory for extended periods as price continues to rally. Don't exit a winning position just because the oscillator is in the 80–100 zone — in strong trends that's the normal state. Use Stoch RSI for entries in pullbacks; use structure (a candle close below the EMA, a break of structure) or a MACD histogram divergence for exits.
- Using Stochastic RSI as a standalone reversal indicator — it fires constantly, and most signals are noise without a trend and structure filter.
- Trading mid-range K/%D crosses (around 40–60) — these carry almost no information and are the source of most false signals.
- Exiting a profitable trend trade because Stoch RSI hit overbought — in a real trend it will stay overbought for many bars.
- Ignoring the higher-timeframe direction and taking both long and short signals — this is how you churn your account on a trending day.
- Stacking Stochastic RSI with RSI and calling it 'confirmation' — they measure the same underlying momentum and largely agree, adding no real edge.