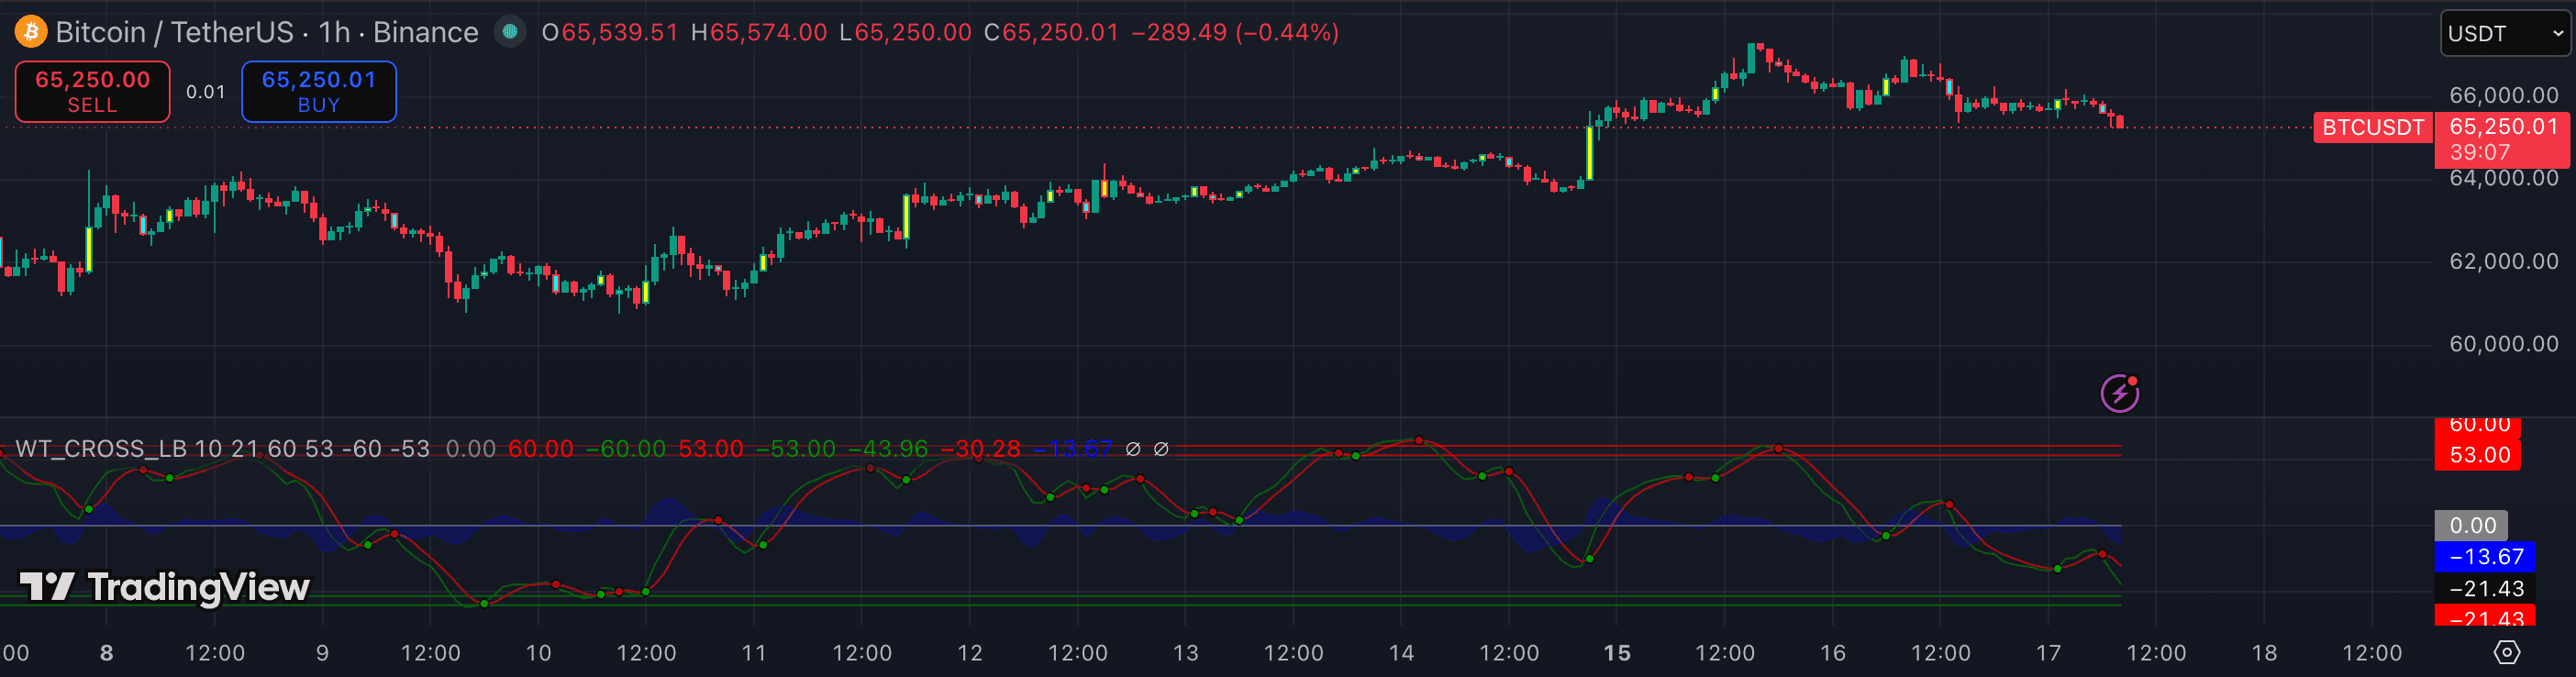
WaveTrend (popularised by LazyBear) is a momentum oscillator that bands price around a smoothed channel and flags overbought/oversold crosses. It became a crypto staple not because it's more accurate than RSI, but because its smoothing produces cleaner visual crosses that fire earlier on major moves. It also forms the core of VuManChu Cipher B. Used as a standalone, it needs the same discipline as any mean-reversion oscillator — here's how to apply it correctly.
1. Understand the two lines — WT1 and WT2
WaveTrend plots two lines: WT1 (the wave channel, derived from a smoothed momentum calculation) and WT2 (a smoothed average of WT1). When WT1 crosses WT2, that is the main signal. The relative position within the oversold/overbought zones determines the quality of the cross — a cross near the oversold zone bottom is the setup you want for longs.
The absolute level of the oscillator tells you the regime: deep in the oversold zone (typically below −60) and turning up = high-quality mean-reversion candidate. A cross in the middle of the range is noise.
2. Trade crosses at extremes, not mid-range
The highest-quality WaveTrend setup is a WT1/WT2 cross that occurs in the extreme oversold or overbought zone. For a long setup: WT1 falls into the oversold zone (below −60 or your configured threshold), then WT1 crosses back above WT2 while both lines are still in that zone. That cross is the trigger, not the entry into the zone.
A mid-range cross (between −20 and +20) carries almost no information — momentum is not at an extreme and the signal has no mean-reversion logic behind it. Require the cross to happen near the bands before acting.
3. Read the divergence dots
WaveTrend plots small dots when it detects a divergence between price and the oscillator. A dot in the oversold zone can flag a bullish divergence setup — price made a new low while WaveTrend's low was higher than the previous one.
These dots are directional hints, not triggers. Require the WT1/WT2 cross after the divergence dot appears before entering. A dot with no cross is a potential setup; a dot followed by a cross is the actual signal.
4. Confirm with higher-timeframe bias
WaveTrend is a mean-reversion oscillator — it performs worst in strong one-directional trends where it fires reversal signals against the move repeatedly. The fix: establish a higher-timeframe trend bias (using Supertrend, the MACD zero line, or price position relative to the 50 EMA on 4h) and only trade WaveTrend crosses in that direction.
In a bullish 4h trend, only take WaveTrend long crosses (oversold zone, WT1 crosses above WT2) on 15m or 1h. Ignore any overbought-zone crosses that suggest shorting — in a trend those are counterproductive. This single filter dramatically improves the hit rate.
5. Pair with a price-structure level for entry precision
WaveTrend gives you timing; a price level gives you location and a stop-loss anchor. The most reliable WaveTrend trades pair the oscillator cross with a structural level: a VWAP reclaim, a Volume Profile HVN, a key EMA, or a prior swing low. When the oscillator cross and the structural level align, the edge is substantially higher.
Without a level, a WaveTrend cross just tells you the oscillator has turned from an extreme — but price may be in the middle of nowhere with no logical support below the entry, making stop placement arbitrary.
- Trading mid-range WaveTrend crosses between −20 and +20 — these carry no mean-reversion logic and generate constant false signals in sideways markets.
- Taking WaveTrend short signals in a bullish trend — the oscillator fires 'overbought' crosses repeatedly against a real uptrend and each one loses.
- Entering on the divergence dot before the WT1/WT2 cross confirms it — the dot is a setup alert, not a trigger; the cross is the trigger.
- Stacking WaveTrend on top of Cipher B, which is built from WaveTrend — they share the same underlying calculation and produce largely identical signals.
- Using WaveTrend without a price-structure anchor, leaving stop placement to guesswork.