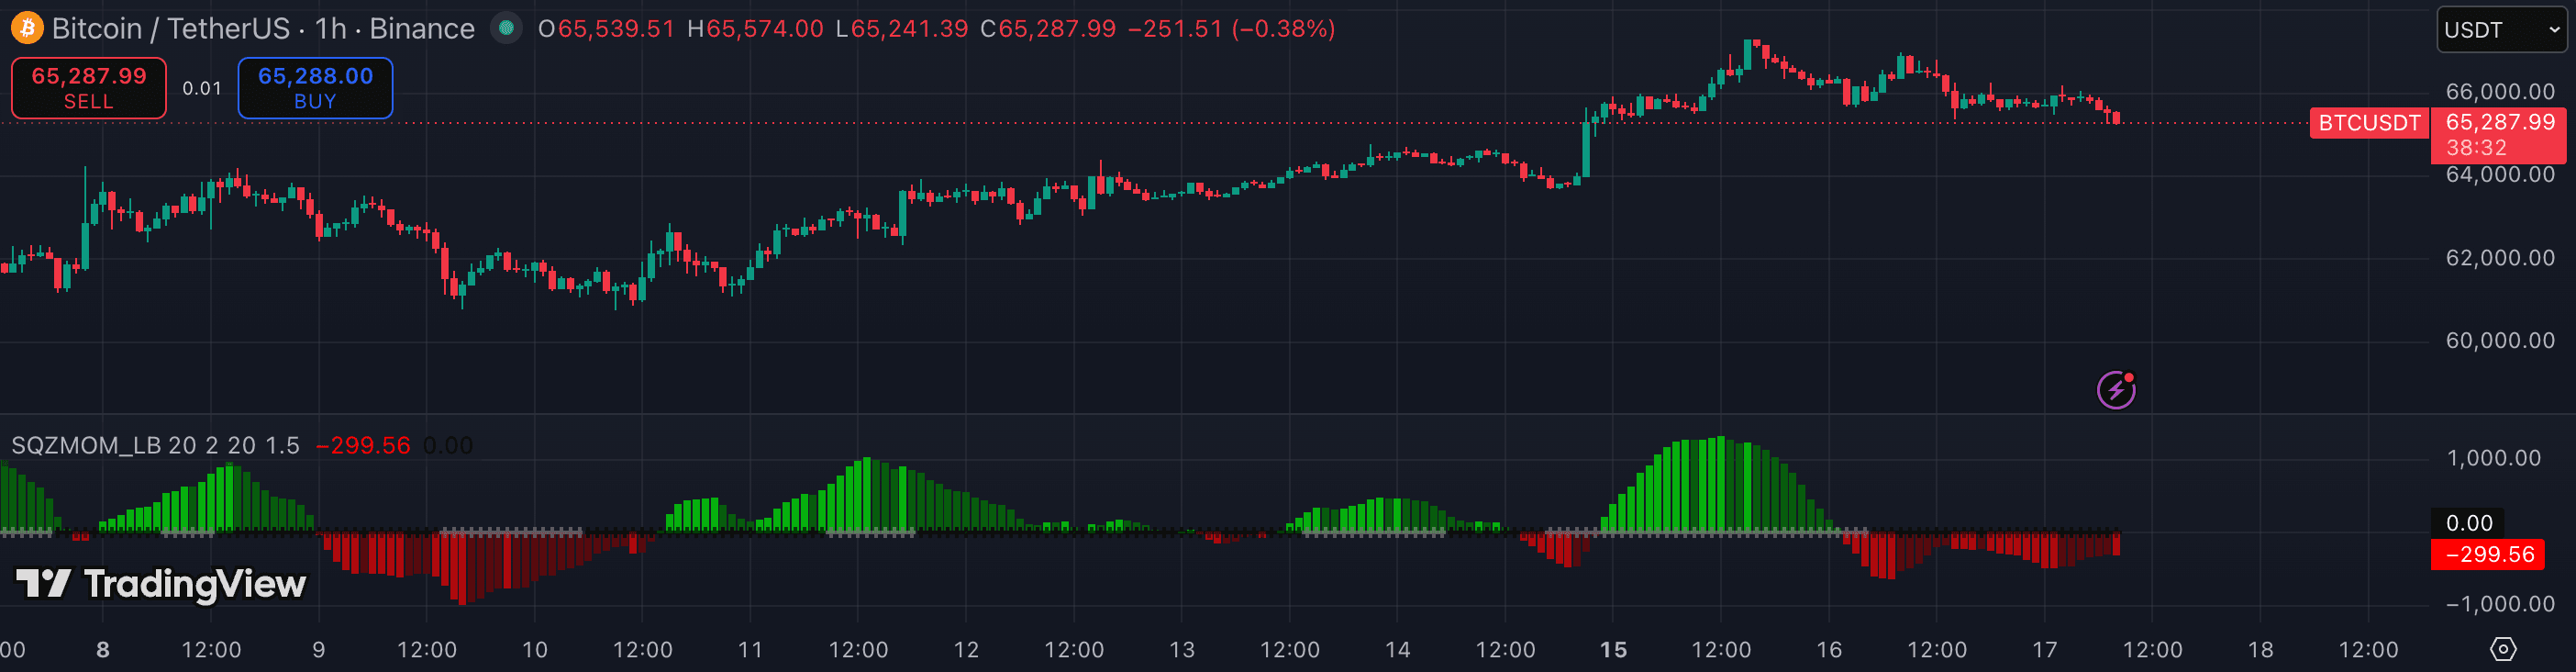
Squeeze Momentum (LazyBear's adaptation of the TTM Squeeze) tells you two things: when the market is coiling in compressed volatility, and which way momentum is building inside that coil. Most traders watch the squeeze dots and miss the histogram — which is the real signal. Here's how to read both layers and use them as a structured breakout filter.
1. Understand what 'the squeeze' actually measures
A squeeze occurs when Bollinger Bands (which widen/narrow with standard deviation) contract inside Keltner Channels (which widen/narrow with ATR). When the BB bands are narrower than the KC bands, price volatility has compressed below its true-range average — that is the squeeze, shown as a series of coloured dots on the indicator.
Red dots mean the squeeze is on (compression active). Green dots mean the squeeze has fired (bands expanding again). The squeeze itself doesn't tell you which way price will break — only that a breakout is likely loading.
2. Read the histogram for momentum direction
The momentum histogram is the element many traders overlook. It shows a momentum calculation that reveals whether buying or selling pressure is building inside the squeeze. Positive and growing bars = bullish momentum. Negative and growing bars = bearish momentum.
The read: when the squeeze fires (dots turn green) and the histogram is positive and rising, price is more likely to break upward. When the histogram is negative and falling as the squeeze fires, downward is the more probable break. This is the histogram's job — it's your directional lean before the candle confirms.
3. Wait for the squeeze to fire before entering
Do not enter during the squeeze (red dots). The compression phase can last many bars — entering early means sitting in a position that goes nowhere, or worse, getting stopped out by a brief fakeout before the real move.
The entry trigger is the transition: dots turn green (squeeze fires) and the histogram is clearly positive or negative. The first or second green dot bar with the histogram aligned is the entry window. Wait for a candle close in that state — not an intrabar signal — before acting.
4. Use the higher timeframe to validate the setup
A squeeze on the 15m is less meaningful than a squeeze on the 4h. As the timeframe rises, squeezes become rarer and the subsequent move tends to be larger. Run the indicator on the 4h or 1D to identify major setups, then drop to a lower timeframe for entry precision.
A squeeze firing on the 4h while momentum histogram is positive, with price sitting at a Volume Profile POC or VWAP anchor, is a high-quality setup. A 5m squeeze that fires into a horizontal resistance zone is routine noise — skip it.
5. Manage the trade when momentum turns
Squeeze Momentum tells you when to enter; it also tells you when momentum is fading. Watch the histogram after entry: as long as bars are growing in your direction, the move is accelerating. When the histogram starts shrinking or bars begin turning shorter each bar, momentum is flagging — tighten the stop or take partial profit.
A histogram that was rising then rolls over before a structure break is often the first warning of the trade ending. You don't need a separate oscillator to act — the histogram alone can signal the exit.
- Entering during the squeeze (red dots) before the compression fires — the move rarely starts during the red phase, and your stop placement has no logic until the direction is confirmed.
- Ignoring the momentum histogram and entering simply because dots turned green — a green dot with a flat or opposing histogram has no directional edge.
- Trading 5m squeezes into known resistance or VWAP — low-timeframe squeezes in unfavourable price locations have poor follow-through.
- Exiting too early when the histogram pauses briefly — brief consolidations inside a squeeze move are normal; only exit when the histogram turns decisively or a structural level breaks.
- Stacking Squeeze Momentum with Bollinger Bands separately — you're doubling the same information. The squeeze indicator already contains the BB read.