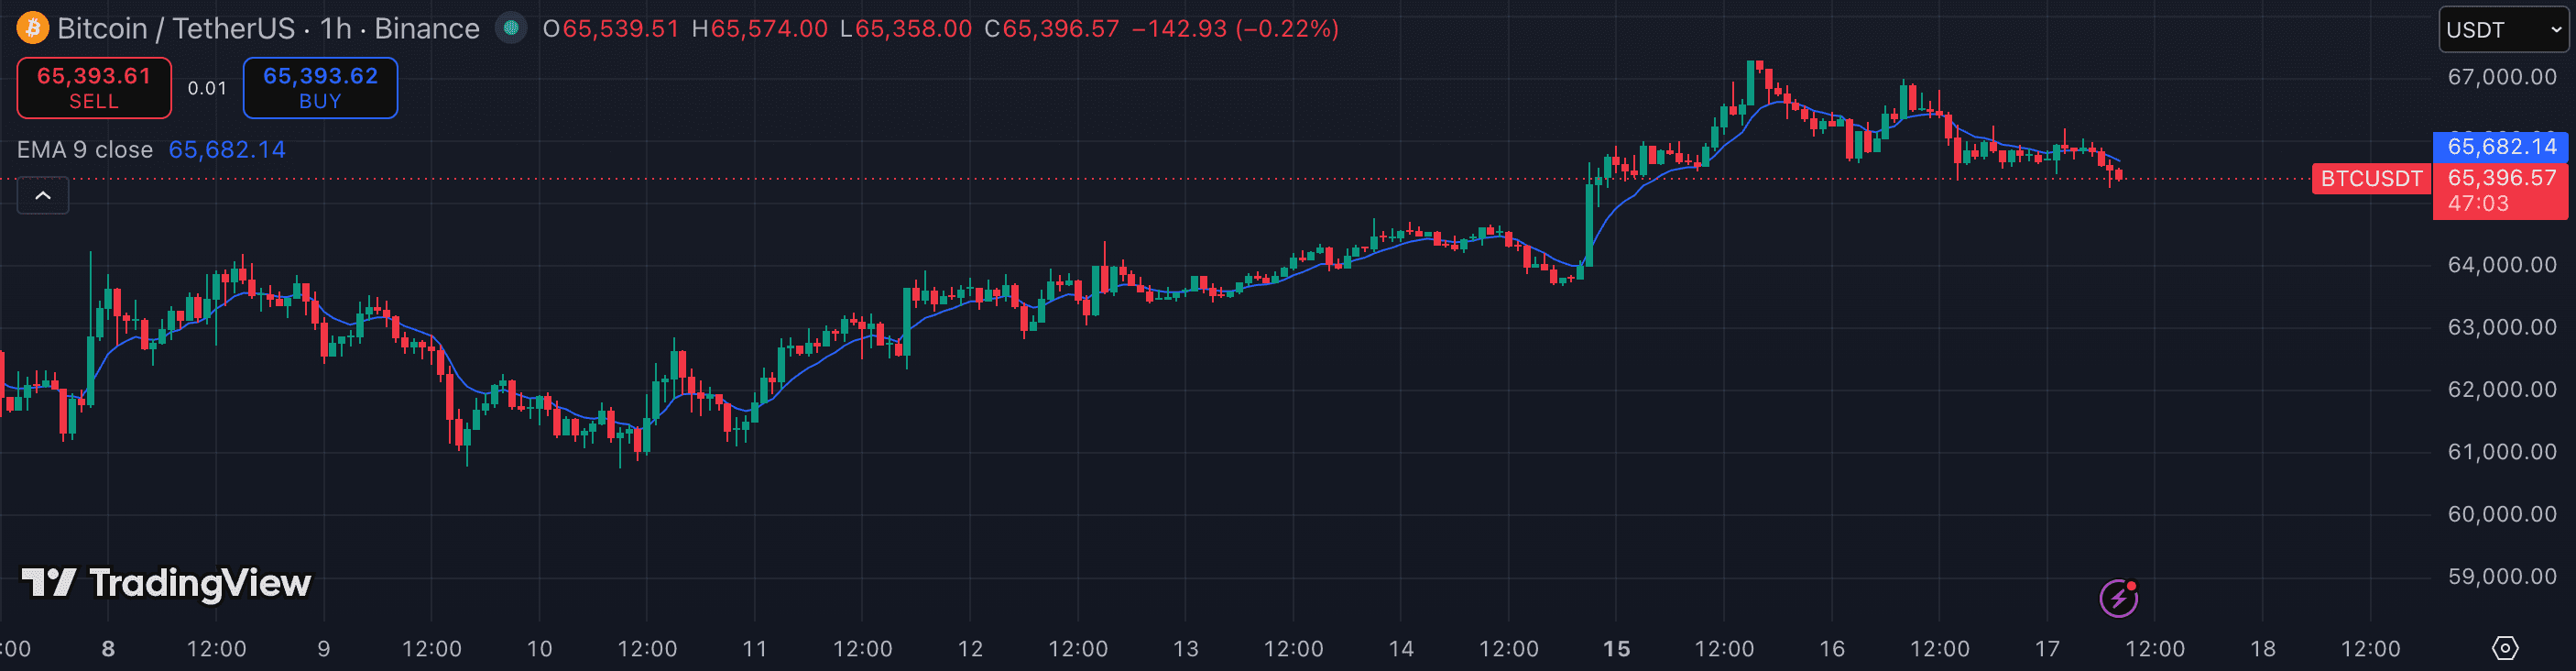
Moving averages are the most widely used indicator in trading — and the most poorly configured. Traders often pile on multiple MAs with arbitrary lengths, creating 'MA spaghetti' that contradicts itself on every candle. This guide explains what each MA parameter actually changes, which specific lengths carry meaning in crypto markets, and how to build a clean, purposeful MA setup for your timeframe.
1. EMA vs SMA: choose based on how you use it
The EMA weights recent bars more heavily than older ones — it turns faster and tracks crypto's fast price action more closely. The SMA weights every bar equally — it is smoother and slower, which makes it better for defining long-term structure that holds even through fast spikes.
For trend-following on crypto (15m, 1h, 4h), use the EMA. It will give you a faster directional bias and cleaner dynamic support/resistance during the move. For higher-timeframe context (daily, weekly) where you want to filter out recent volatility, the SMA's smoothness is actually an advantage — the 200-day SMA is watched by more participants than the 200-day EMA and therefore becomes more self-fulfilling.
2. Understand which period lengths carry real meaning
Not all MA lengths are equal. Certain periods are watched by enough traders that they become self-fulfilling support/resistance. In crypto, the most watched EMAs are: 9 (short-term momentum), 21 (roughly one month of daily bars — widely used for short-term trend), 50 (medium-term trend filter), 100, and 200 (the major long-term bias divider). On shorter timeframes, 8, 13, 21, and 55 reference the Fibonacci sequence and are common in many active-trader setups.
Avoid exotic lengths like 37 or 63 — these carry no structural significance and are purely the result of curve-fitting. Stick to the lengths that large numbers of traders actually watch.
3. Use a single MA as a bias filter, not a signal generator
The most robust use of a moving average is not to generate buy and sell signals from crossings, but to define which side of the market you're on. Price above the 21 EMA on the 1h = bullish bias; only look for long setups. Price below = bearish bias; only look for short setups.
This single-rule approach eliminates the majority of counter-trend trades that hurt new crypto traders. The MA is doing one job: telling you whether the current bar's momentum context is bullish or bearish. For signals, use a separate oscillator (RSI, Stoch RSI) or price-action trigger.
4. Build a two-MA stack for trend confirmation
The most common crypto trend setup uses two EMAs: a fast and a slow. Popular combinations: 9/21 EMA (intraday crypto, responsive), 21/55 EMA (1h–4h, balanced lag vs signal quality), 50/200 EMA (daily, the 'golden/death cross' watched by institutional desks).
When the fast EMA is above the slow EMA, the short-term trend is bullish. When it crosses below, momentum is turning. In a strong trend, the pullback to the fast EMA (9 or 21) is the re-entry opportunity — not the fast/slow cross itself, which lags by definition.
5. Match the period to the timeframe's average candle count
A 21 EMA on a 4h chart covers 84 hours — about 3.5 days. A 21 EMA on a daily chart covers 21 days — 3 trading weeks. The same period means very different lookback windows on different timeframes. Build your MA periods around how many trading periods equal the structure period you care about.
On 5m charts: 9 and 21 EMA cover a few hours — useful for scalp session structure. On 1h: 21 EMA (21 hours) and 55 EMA (about 2.3 days) give intraday and short-swing context. On 4h: 50 EMA (8+ days) and 200 EMA (33+ days) define medium-term and long-term structure.
- Adding five or more MAs to one chart — overlapping lines contradict each other on every bar and create indecision rather than clarity.
- Using MA crossings as the primary signal on crypto — in choppy markets, fast/slow EMA crosses whipsaw constantly and generate dozens of losing trades.
- Assuming the 200 EMA is always the key long-term level — on many crypto pairs, the 200 SMA and 200 EMA sit at meaningfully different prices. Know which one the crowd watches for that specific market.
- Applying the same MA periods across all timeframes without adjusting for what time window they actually cover.
- Treating the MA as a hard support/resistance line rather than a zone — price routinely pierces through a moving average intraday and closes on the right side. Wicks through a MA are not breaks.