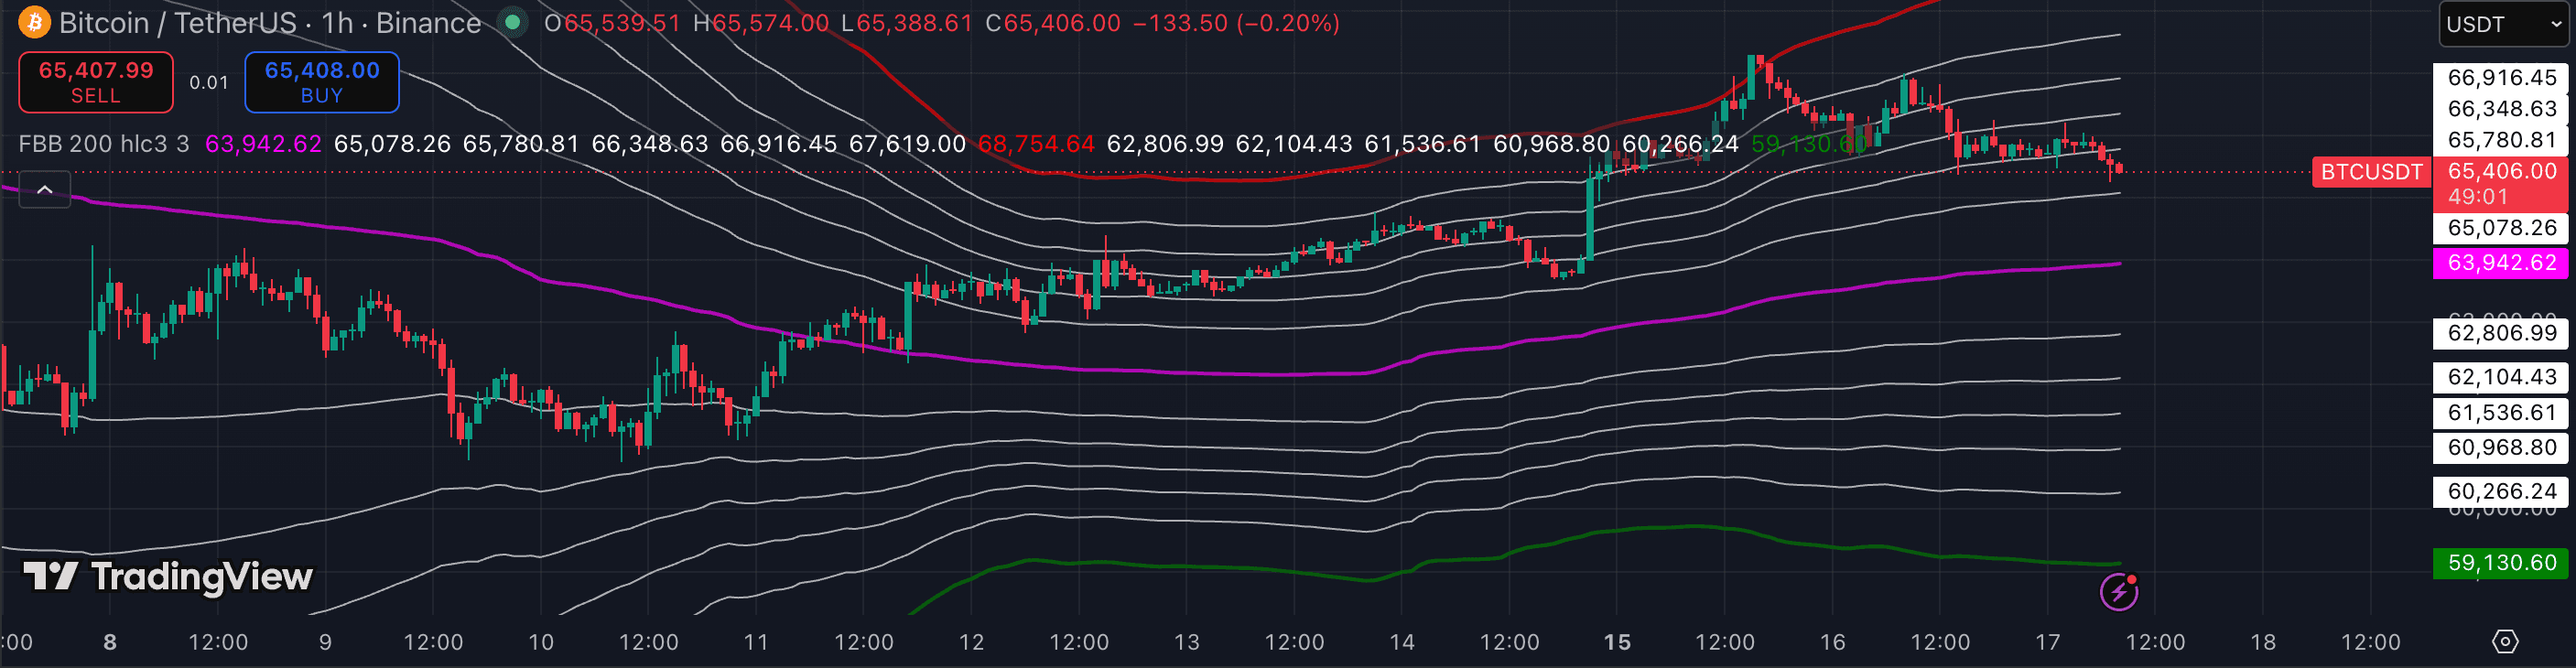
Bollinger Bands plot a moving average with two bands set two standard deviations away from it. As volatility rises, the bands expand; as volatility compresses, they contract. That band width itself — not the band touches — is the most important signal Bollinger Bands produce. Here's how to read the bands correctly and avoid the most common trap: assuming the outer band means 'reverse here.'
1. Read band width first, not band touches
The single most important Bollinger Bands signal is the width of the bands, not where price is relative to them. Narrow bands (a squeeze) mean volatility is compressed and a breakout is approaching — often the biggest move of a session. Wide bands mean volatility is expanded and a reversion toward the mean is more probable.
Before doing anything else with Bollinger Bands on a chart, look at whether the bands are narrow or wide relative to their recent history. That tells you which regime you're in.
2. Trade the squeeze setup
A Bollinger Band squeeze occurs when the bands contract to their narrowest in a significant period. On crypto, the most reliable squeeze confirmation is when the Bollinger Bands also contract inside the Keltner Channels — the Squeeze Momentum indicator automates this check.
When the squeeze fires (bands start expanding back out), enter in the direction of the momentum histogram or the first strong breakout candle. The squeeze doesn't tell you direction — the momentum histogram or the first candle after expansion does.
3. Use band tags for trend continuation, not reversal
In a strong uptrend, price rides or repeatedly tags the upper Bollinger Band — this is normal trend behaviour, not a sell signal. A tag of the upper band in a trend means momentum is strong, not stretched.
A band tag only becomes a reversal signal when the market is clearly range-bound (not trending) or when the tag comes with bearish divergence on RSI or MACD. In trending conditions, fading a band tag is usually a losing trade.
4. Mean reversion trade: band-to-band in ranges
When price is in a clear range (ADX below 20, no structural trend), the Bollinger Bands frame the range visually. A tag of the lower band with a bullish rejection candle (pin bar, engulfing) targets the midline (the 20 SMA) and potentially the upper band.
Manage these trades tightly: the midline is the first target for partial profit, and the trade invalidates if price closes outside the band rather than rejecting it.
5. Combine with RSI for band-tag quality
The highest-quality Bollinger Bands setups pair a band tag with RSI confirming the same read: lower band tag + RSI oversold (below 30) in a range = strong reversal candidate. Upper band tag + RSI overbought (above 70) in a range = strong short candidate.
In a trend, ignore RSI extremes with band tags — they're not the same signal. The filter is whether the market is ranging or trending, not whether RSI is at 70.
- Selling every upper band touch and buying every lower band touch — in a trend this produces loss after loss against the direction of the move.
- Ignoring band width entirely and focusing only on where price is relative to the bands.
- Trading the squeeze without knowing which direction momentum is breaking — enter after the expansion candle, not as soon as the squeeze dots turn green.
- Using Bollinger Bands on 1m charts where standard-deviation calculations are too noisy to carry meaningful information.
- Setting the deviation too low (e.g. 1.0) which tags the band constantly and generates too many false signals.