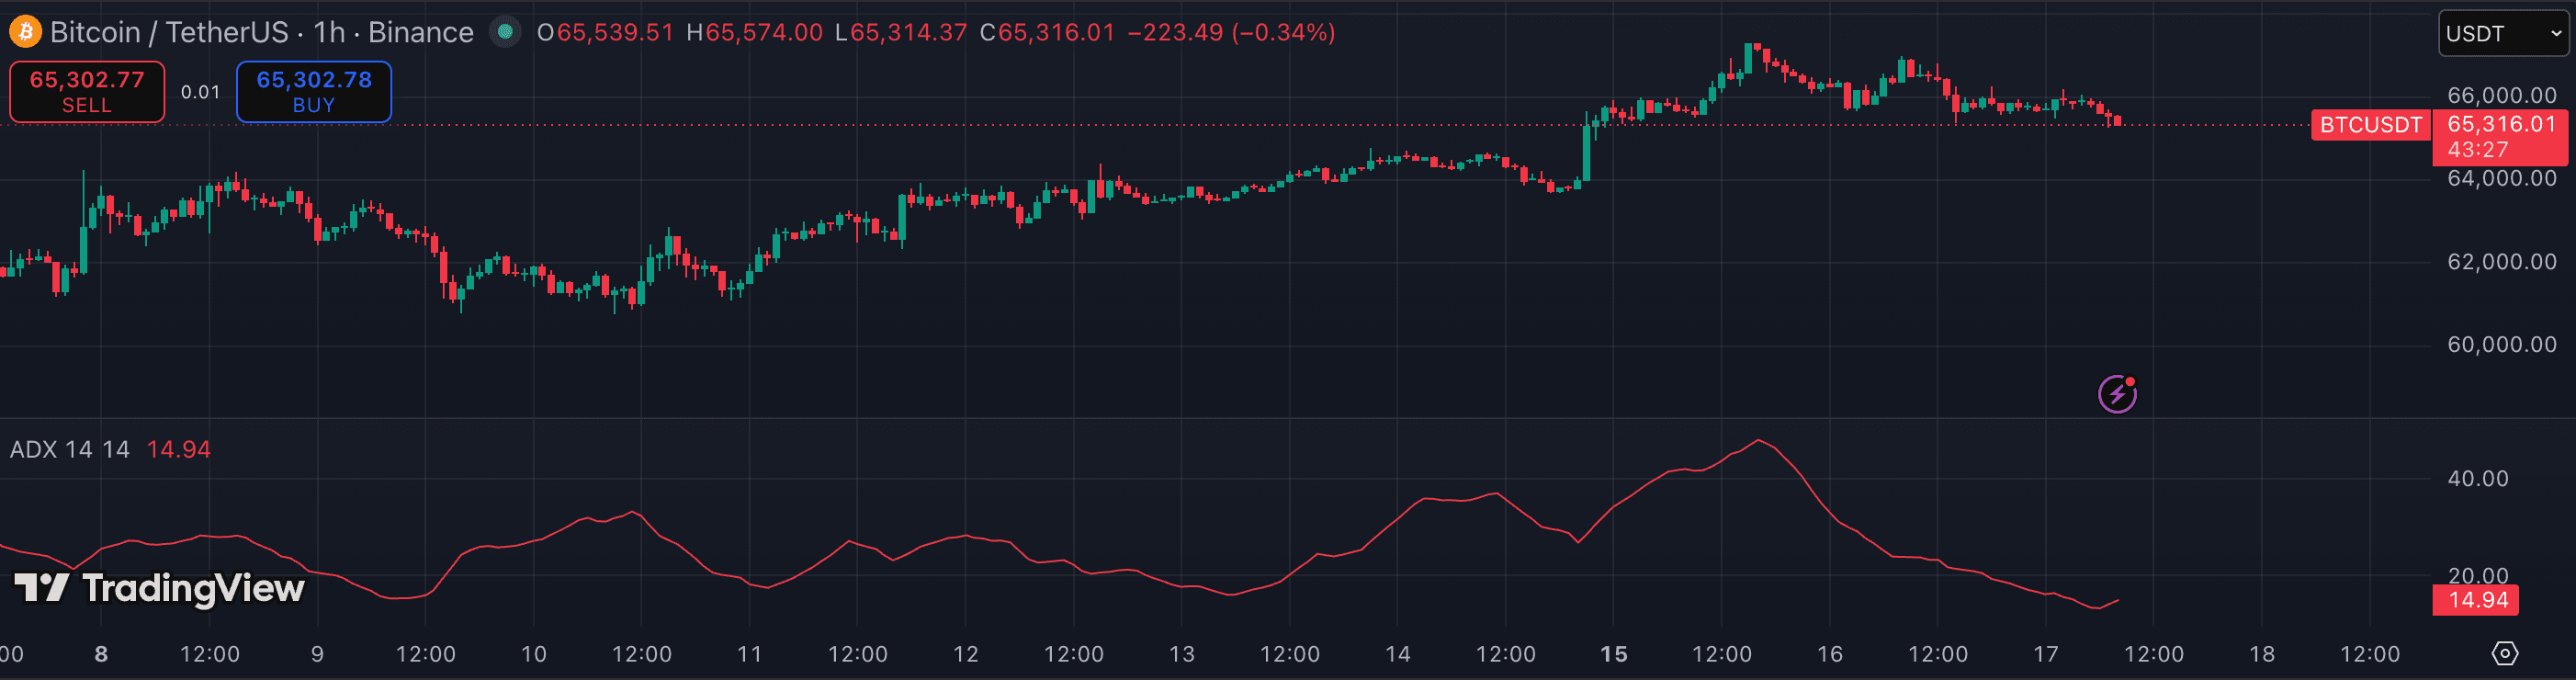
ADX (Average Directional Index) measures trend strength on a 0–100 scale without telling you which direction the trend is moving. That distinction matters: a high ADX reading means a strong trend is present, but it could be up or down — ADX is completely directionally neutral. Its value is as a filter layered on top of your trend indicators. When ADX is high, your EMA crosses and Supertrend flips are more reliable. When ADX is low, they're noise. Here's how to read it and apply it.
1. Understand the three components
ADX is usually plotted with two additional lines: +DI (Positive Directional Indicator) and −DI (Negative Directional Indicator). The +DI measures upward movement; the −DI measures downward. When +DI is above −DI, up-moves are dominating. When −DI is above +DI, down-moves are dominating. The ADX line itself (the main line) shows how strongly either side is winning.
The key read: ADX tells you the intensity of the trend; +DI and −DI tell you which side is in control. A high ADX with +DI above −DI is a confirmed uptrend. A high ADX with −DI above +DI is a confirmed downtrend.
2. Use the 20–25 threshold as your trend gate
The classic read: ADX below 20 means no trend — the market is ranging or choppy, and trend-following tools will whipsaw. ADX above 25 means a trend is present and worth following. This threshold is the most useful single rule ADX offers.
Apply it as a gate on other signals: only take EMA crosses, Supertrend flips, or MACD line crosses when ADX is above 20–25. This one filter removes most of the losing trades those tools produce in flat tape.
3. Read ADX direction, not just level
A rising ADX — even if it's still below 25 — means a trend is strengthening. A falling ADX means the trend is losing momentum, regardless of its absolute level. An ADX that peaks above 40 and starts falling often signals the trend is exhausting, even if price is still moving.
This dynamic read is useful for exits: when ADX has been above 30 and starts declining while +DI and −DI converge, the trend is running out of energy. Tighten your stop or take partial profits before the actual reversal candle arrives.
4. Combine ADX with a directional trigger
ADX is never a standalone entry tool — it tells you when to use your other tools, not when to enter. The standard stack is: ADX above 20 (trend present) + Supertrend or EMA cross in the direction of +DI/−DI dominance = take the signal. ADX below 20 = sit out regardless of what the directional tool says.
For crypto swing trades, a common setup runs ADX on the 4h chart as a filter and uses a 1h Supertrend or RSI divergence for entry timing. The ADX gate ensures you're only entering when the higher timeframe has confirmed a real move, not range noise.
5. Know ADX's limits in crypto
ADX lags — it confirms a trend after it's been running for several bars. In fast-moving crypto markets, ADX crossing above 25 can happen late enough that you miss a significant portion of the initial move. The fix is to use it as a confirmation filter rather than an entry trigger, and to act on the signal as soon as ADX crosses the threshold rather than waiting for it to rise further.
ADX also struggles with ranging markets that have brief, sharp moves — a single large candle can briefly spike ADX above 25 and then fade immediately. Require at least two to three bars with ADX above threshold before trusting the read.
- Using ADX to determine trend direction — a rising ADX with no DI lines read tells you nothing about which way price is moving.
- Taking the first bar above the threshold as a trade trigger — require two to three bars of ADX above 20–25 to avoid false spike readings from single large candles.
- Ignoring ADX direction (rising vs falling) and only watching the absolute level — a declining ADX from 35 often signals more danger than a rising ADX at 22.
- Using ADX as an entry signal rather than a filter — it does not time entries, it gates whether trend tools should be trusted.
- Running ADX on a 1m chart where the period is too short to produce a meaningful trend reading.