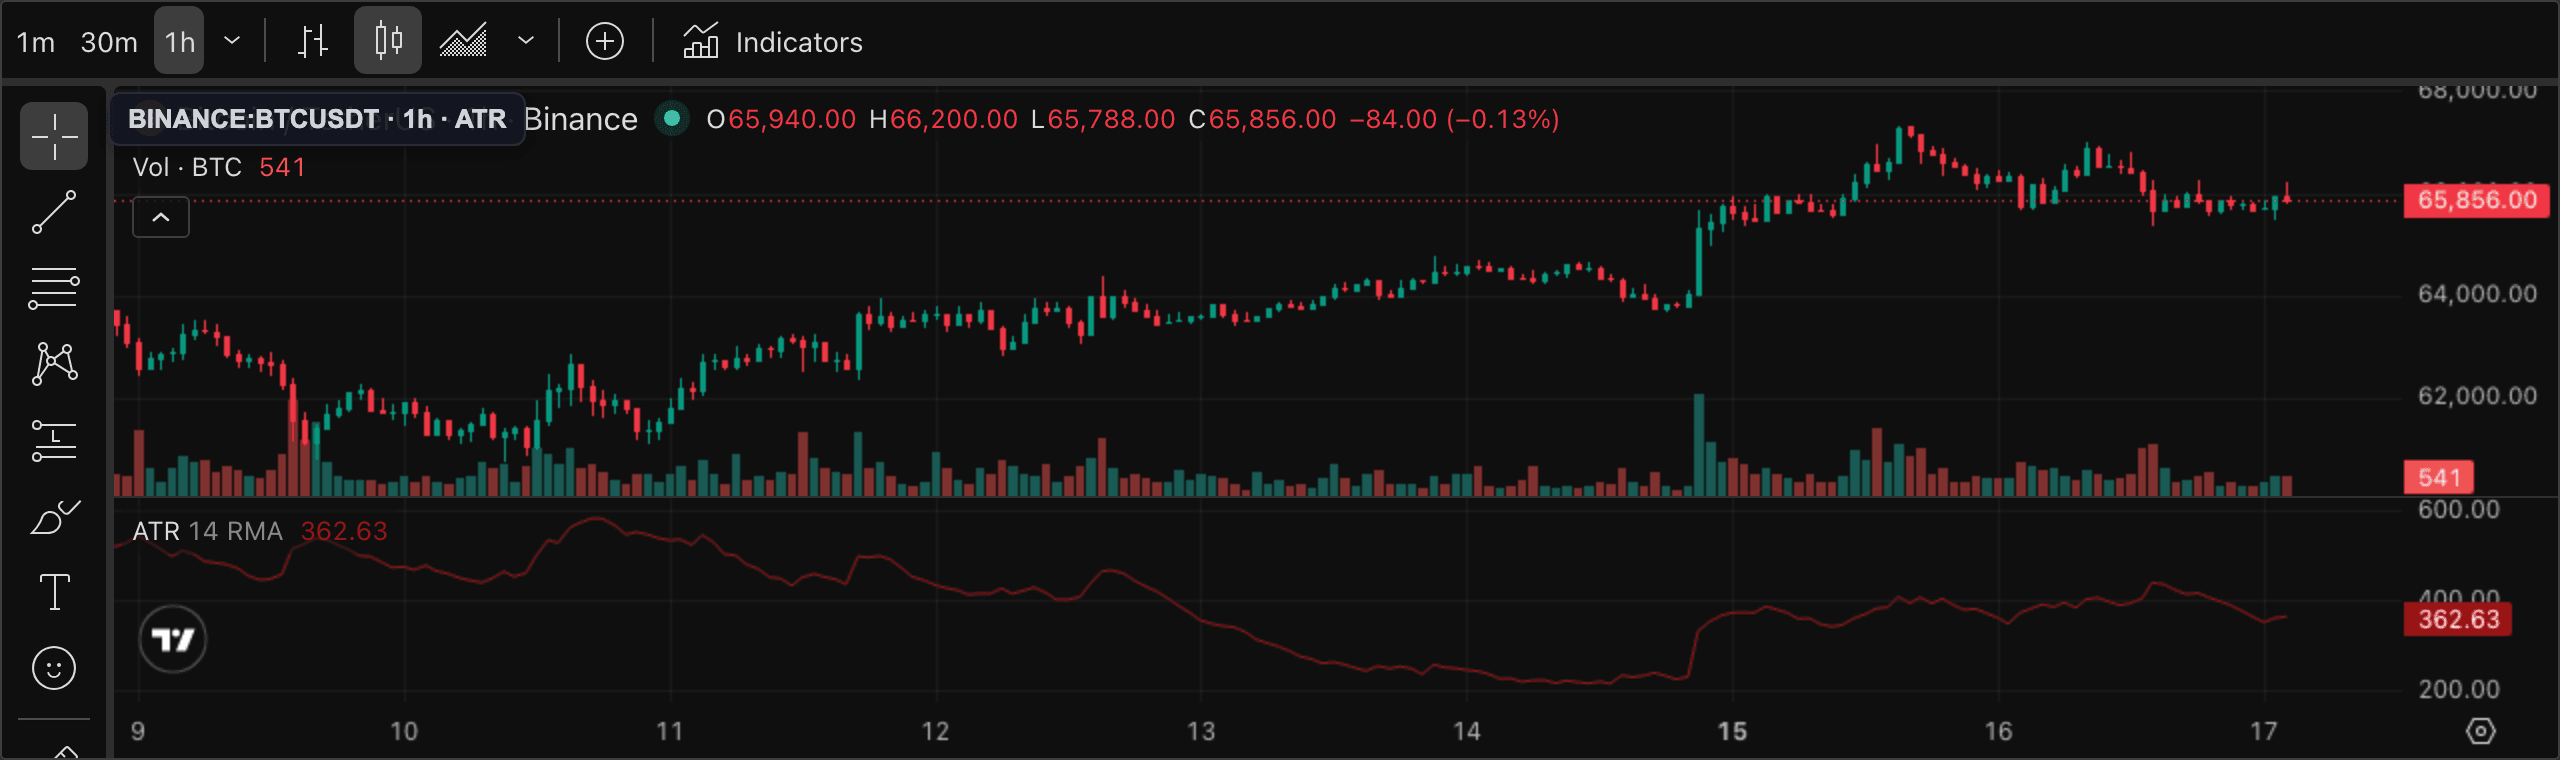
ATR (Average True Range) measures how much price is actually moving, averaged over a lookback period (default 14). It is a pure volatility number — it says nothing about direction. Its power is in what you do with that number: stops sized to ATR adapt to the market instead of a fixed percentage, and an expanding or contracting ATR tells you whether the market is waking up or going quiet. This guide shows you the three uses that genuinely improve your trading.
1. Understand what ATR measures — and what it doesn't
ATR averages the 'true range' of each bar: the largest of (high minus low), (high minus prior close), or (low minus prior close). That last element catches overnight gaps — a common occurrence in crypto where price can move significantly between sessions. The result is a number in price terms: if ATR on BTC/USDT 1h is 350, each hourly candle has been moving, on average, $350.
ATR does not tell you which way price will move. A high ATR means large candles; a low ATR means small candles. That is the entire read — direction comes from your other indicators.
2. Size your stops to ATR instead of a fixed percentage
The most practical ATR application is stop placement. Instead of setting a stop '2%' below entry — which stays the same regardless of whether the market is calm or volatile — set it a multiple of ATR below entry. A 1.5× or 2× ATR stop adapts: in volatile conditions the stop widens automatically so you don't get shaken out by normal noise; in quiet conditions it tightens to preserve more capital.
A common rule: stop = entry price minus (1.5 × ATR) for swing trades. On scalps you may use 1× ATR or less. The point is that the stop reflects how much the market is actually moving, not a round number.
3. Set profit targets with ATR
ATR can also anchor initial profit targets. A simple framework: minimum target = 1× ATR from entry, with a partial exit there and a trailing stop for the remainder. This prevents you from setting a target that is structurally impossible given current volatility — if ATR is $200 and you set a $2000 target on a 15m trade, you're asking the market to do 10× its normal range.
ATR-based targets are particularly useful in crypto where the daily range varies enormously between quiet periods and trending conditions. A target that made sense last week may be too tight or too wide this week — ATR adjusts automatically.
4. Read ATR to detect regime changes
Beyond stop and target sizing, ATR's level tells you which volatility regime the market is in. Rising ATR means candle ranges are expanding — often the early sign of a breakout or an acceleration. Falling or compressed ATR means the market is quieting, typical before a large move, and also a signal that your trailing stops can tighten.
A useful habit: glance at ATR on the 1D chart before each session. If ATR is well above its recent average, the market is in expansion mode and oversized positions carry more risk. If ATR is compressed near a multi-week low, a volatility spike may be approaching.
5. ATR is already inside your other tools
ATR powers Supertrend (the band is a multiple of ATR away from price), UT Bot Alerts (the key value is an ATR multiplier), and Keltner Channels (the band width is ATR-based). Understanding ATR makes those tools click: when Supertrend's band suddenly widens during a volatile session, it's because ATR rose — and now you understand why the flip threshold moved further from price.
This underpinning is why ATR is worth learning even if you never plot it directly on your chart — it is already shaping the behavior of the tools you use every day.
- Using a fixed-percentage stop when ATR-based stops are available — a 2% stop is too tight in high-volatility sessions and too wide when the market is quiet.
- Setting profit targets many multiples of ATR away — if the market typically moves $200 per bar, a $2000 target requires an unusually large move or a very long hold.
- Treating a high ATR as a directional signal — expanding volatility means large candles, not a prediction of which way they will go.
- Ignoring ATR entirely and letting trailing stops (Supertrend, UT Bot) behave as black boxes, when understanding ATR explains their every behavior.
- Using ATR period 14 on 1m charts, where the smoothing is too slow to reflect intraday volatility shifts — shorten the period on very low timeframes.