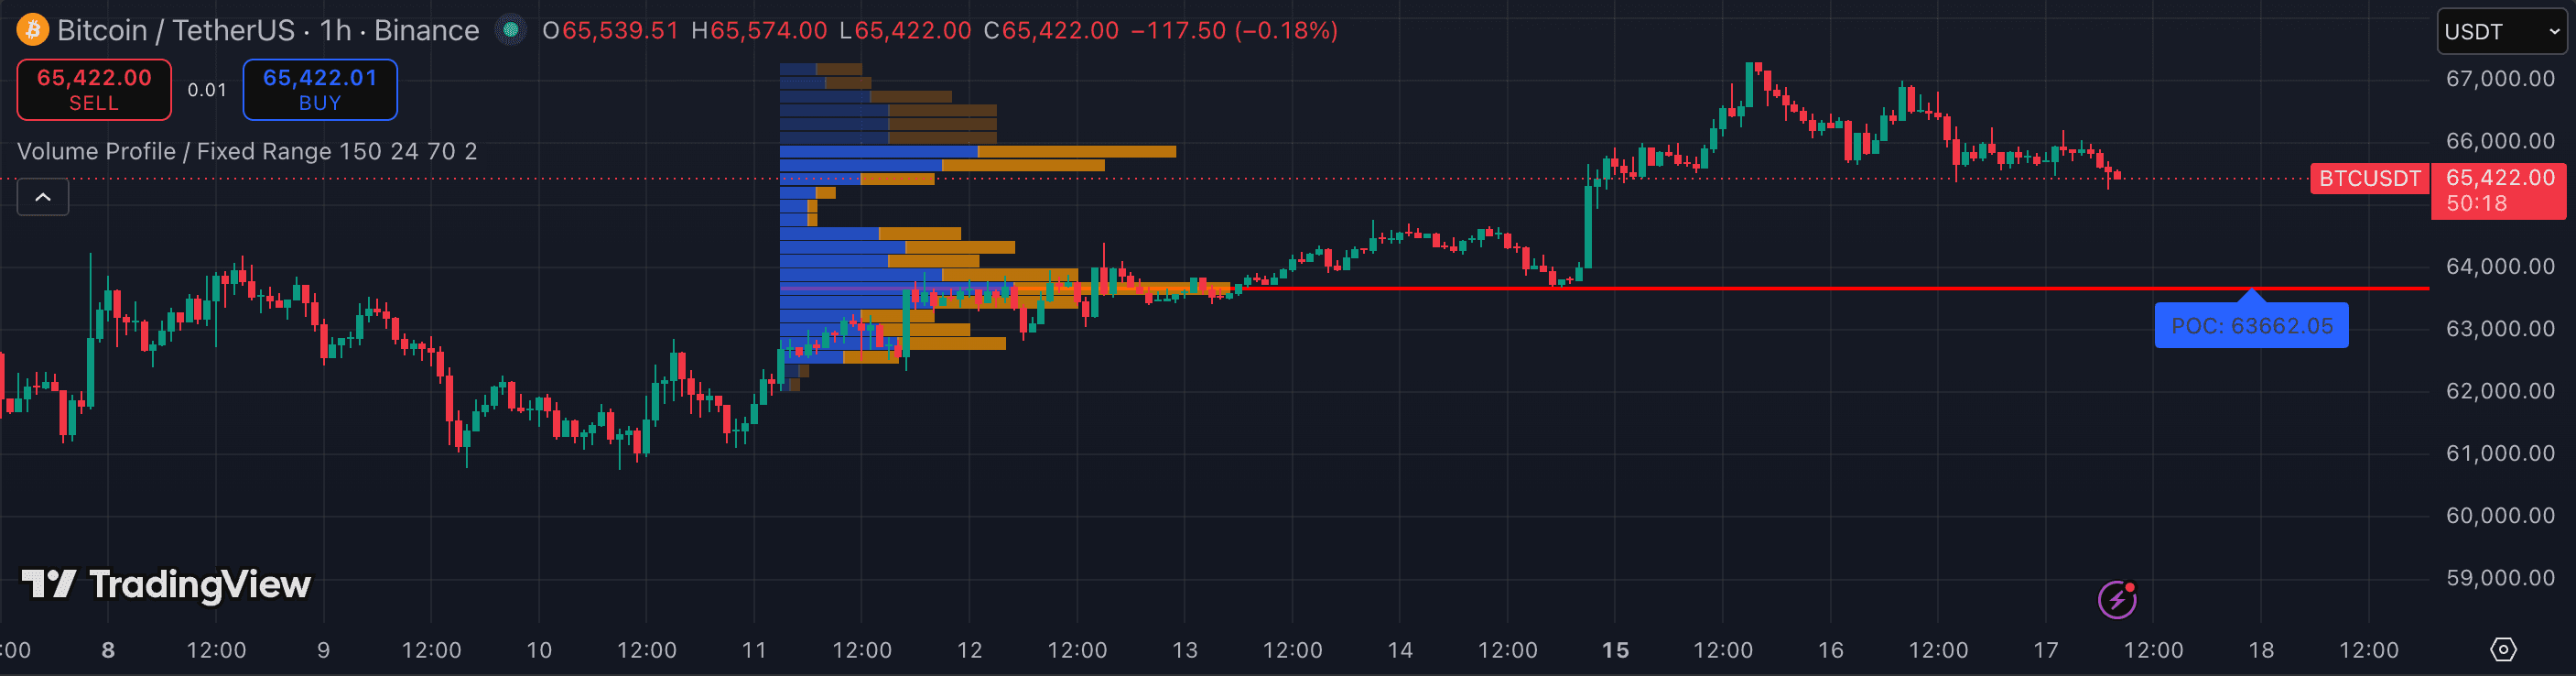
Volume Profile's power comes entirely from how you anchor it. The indicator itself has only a handful of settings, but setting the anchor period and row count incorrectly turns a precision level-mapping tool into an unreadable smear. Here's how to configure it for crypto trading.
1. Choose the right Profile type for your analysis
TradingView offers several Volume Profile variants: Fixed Range (FRVP), Session Volume (SVVP), and Visible Range (VRVP). For most crypto analysis, Fixed Range is the most useful — you anchor it precisely to a swing or event you care about.
Visible Range is popular because it auto-updates as you scroll, showing the profile for whatever bars are on screen. It is fine for a quick structural read, but it changes as you zoom — not ideal if you need a stable reference level.
Session Volume is most relevant for futures traders or anyone tracking intraday accumulation within a daily session.
2. Set the Row Size / Row Count
Row Count controls how many horizontal bars the profile is divided into. Too few rows and you lose resolution; too many and every row becomes noise. A good default is 24 rows for day-trading reads and 48 rows for swing/position analysis.
On crypto, larger Row Counts (64+) can be useful on BTC and ETH where there is enough volume density to make fine-grained HVN/LVN meaningful. On altcoins with lower volume, keep it at 24 or fewer.
3. Anchor the Fixed Range profile correctly
For a trend context read: anchor from the most recent major swing low to the current bar. The Point of Control (POC) in this range is the highest-conviction value area for the move.
For a range context: anchor from the top to the bottom of the consolidation. HVNs inside the range are acceptance zones (expect choppy price); LVNs are where price may knife through quickly on a breakout.
For a session read (useful for day traders): anchor the profile to the daily open. The POC for the session is the intraday fairness reference — price above it is bullish-biased for the day, below is bearish.
4. Read the Value Area — not just the POC
The Value Area (VA) covers the price range where 70% of the session's volume traded. The VA High (VAH) and VA Low (VAL) are the key levels: price often pauses or reverses at these boundaries as it decides whether to accept or reject the value zone.
A common pattern: price drops below VAL, stabilizes, then reclaims it — this reclaim signals acceptance back into value and is a bullish structural signal. The reverse (breakdown below VAL that holds) is bearish.
- Using Visible Range as a stable reference level — it moves as you scroll and is not a fixed anchor for a repeatable read.
- Setting Row Count too low (8–12) and reading the resulting blobs as if they were precise levels — resolution matters for POC accuracy.
- Trading the POC as if it is a reliable reversal level in all conditions — POC is a high-volume magnet and S/R zone, but price can slice through it in strong trend moves.
- Ignoring the Value Area High and Low in favor of only watching the POC — VAH and VAL are often cleaner decision points than the POC itself.
- Using Volume Profile on low-cap altcoins where thin trade history produces misleading profiles — stick to BTC, ETH, and high-volume alts.