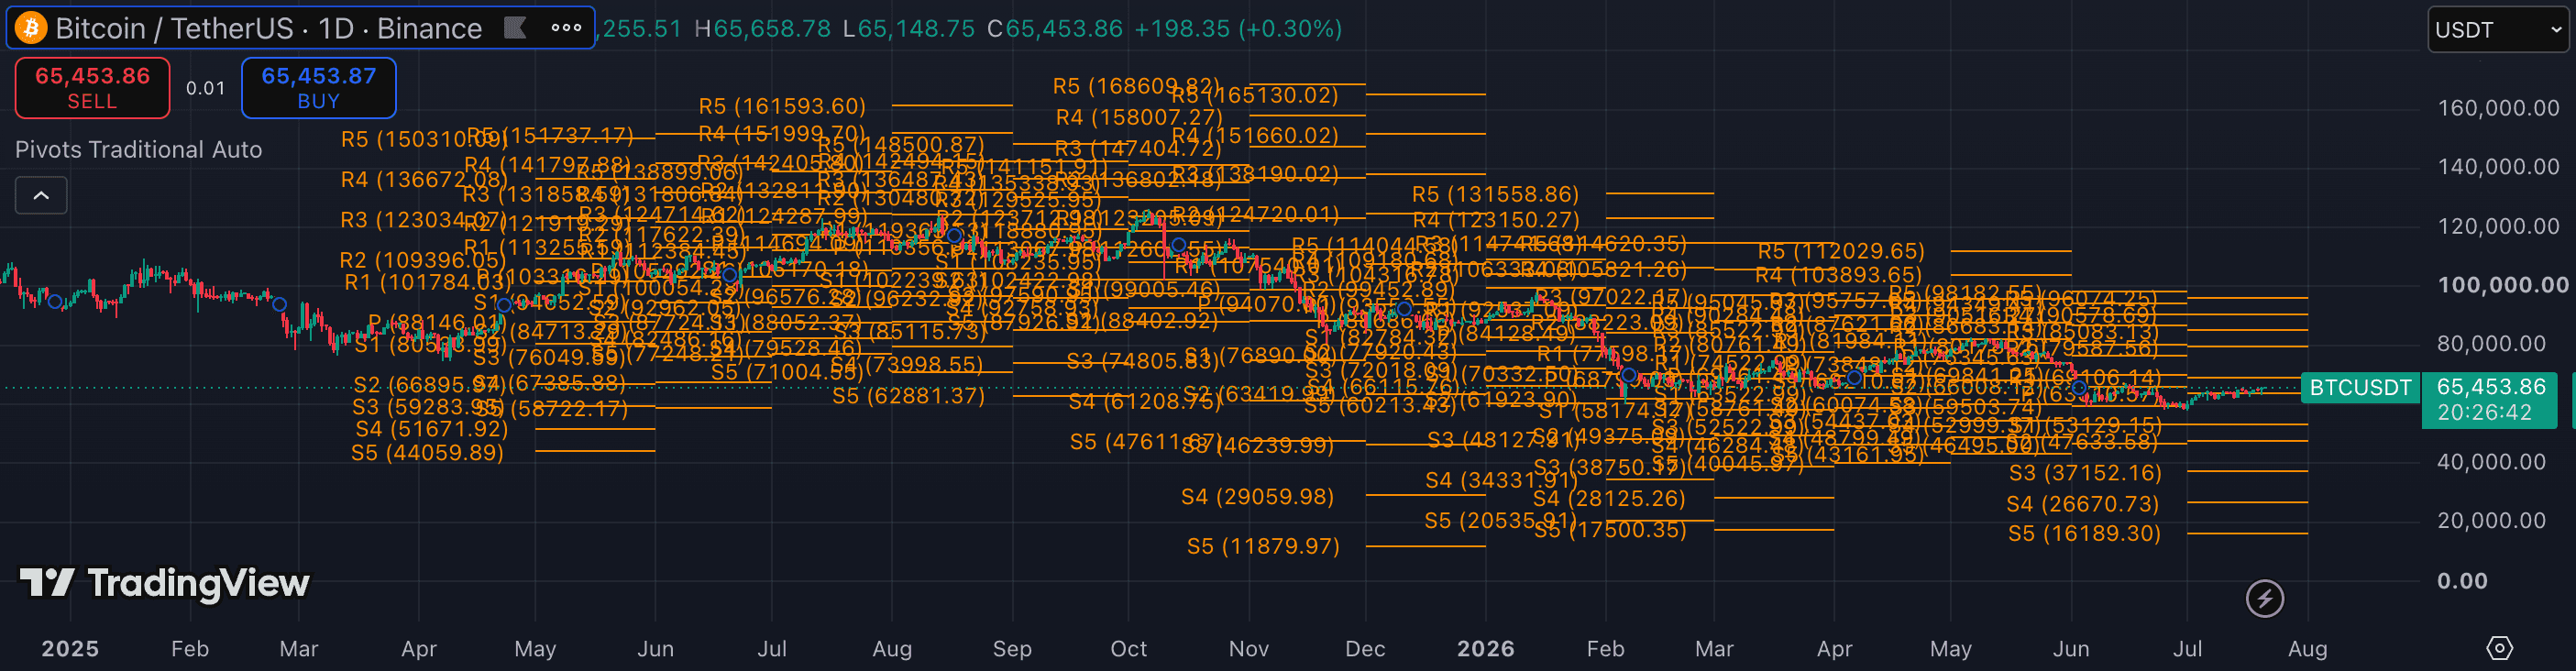
Pivot Points calculate support and resistance levels automatically from the prior period's high, low, and close. They're not price-action art — they're arithmetic — which means they are objective, consistent, and widely watched enough to become self-fulfilling on liquid pairs. The problem is that 'Pivot Points' covers several calculation methods and anchoring choices, and the wrong pairing with your timeframe produces levels the market ignores. This guide maps the correct settings to each trading style on crypto.
1. Understand the four main calculation types
Traditional (Classic): Pivot = (High + Low + Close) / 3, with R1/R2/R3 and S1/S2/S3 derived from that pivot. The most widely watched method — when in doubt, start here because the community's attention makes these levels more likely to be respected.
Fibonacci: Uses Fibonacci ratios (38.2%, 61.8%, 100%) applied to the prior range to generate the S/R levels. Useful when the market is clearly in a trending or impulsive phase and Fibonacci confluence is meaningful.
Camarilla: Places eight levels much closer to the current price using a fixed mathematical constant. Designed for mean-reversion day traders who need tight intraday levels. Levels R3/R4 and S3/S4 are the Camarilla breakout zones.
Woodie: Similar to Traditional but weights the close more heavily. Some traders find it produces slightly cleaner intraday levels on liquid crypto. The difference from Traditional is marginal for most uses.
2. Choose the right period anchor
The 'period' determines which prior candle the calculation uses as its input. Daily pivots use yesterday's high/low/close — appropriate for intraday traders (1m–1h) who want levels that reset every 24 hours. Weekly pivots use last week's range — appropriate for day traders and swing traders who need levels that hold across multiple sessions. Monthly pivots are structural references for position traders.
The most common mistake on crypto is using Daily pivots on a 4h chart. Because crypto trades 24/7, the 'daily' session is somewhat arbitrary — but the daily OHLC (midnight-to-midnight UTC) is still the most widely shared input, which preserves its self-fulfilling quality even without a true market open and close.
3. Match the period to your timeframe
For scalping (1m–5m): Daily Traditional or Camarilla pivots. The Camarilla R3/R4 and S3/S4 levels give intraday breakout zones that are tighter and more actionable than Traditional R2/R3 for very short holds.
For day trading (15m–1h): Daily Traditional pivots. The classic P/R1/S1 set contains the majority of the day's meaningful price action — most sessions resolve within R1 and S1, making these levels the most relevant for entry and target planning.
For swing trading (4h–1D): Weekly Traditional pivots. Weekly S1/R1 levels on crypto align with multi-session support and resistance that the 4h chart clearly honours. Add monthly pivots as the outermost structural reference for targets.
4. Trade the pivot level with a reaction signal
A pivot level is not an automatic entry — it is a location to watch for a trading signal. The workflow: price approaches a pivot level → wait for a rejection candle (wick, pin bar, engulfing) → confirm with a momentum read (RSI divergence, Stochastic %K/%D cross from extreme, MACD histogram direction) → enter on the confirmation candle with a stop just beyond the level.
The highest-quality pivot trades occur at the main Pivot Point (P) and the first support/resistance levels (S1, R1). These levels are watched by the most participants, giving them the strongest self-fulfilling properties. Outer levels (S2/R2, S3/R3) are valid targets but weaker entry zones.
5. Combine with VWAP for intraday trades
Pivot Points give you static levels calculated from the prior period; VWAP gives you a dynamic level that updates with current-session volume. When a pivot level and VWAP converge near the same price, that zone has two independent sources of significance — and the trade off that confluence is higher quality than either level alone.
A practical example: price pulls back to the Daily Pivot Point (P) on a 15m chart, and VWAP happens to sit within $100 of that level. The combination makes a rejection off that zone higher-probability than a pivot level that VWAP has separated from by several hundred points.
- Using Daily pivots on a 4h or 1D chart — the daily reset is too frequent for the slower timeframes and produces levels that shift before they can be acted on in a swing context.
- Entering directly at a pivot level without waiting for a rejection signal — price can slice through any mechanical level if momentum is strong enough.
- Treating all six S/R levels as equally important — the main Pivot Point and S1/R1 carry the most self-fulfilling weight; outer levels are secondary targets, not primary trade locations.
- Stacking multiple pivot types simultaneously (Traditional + Fibonacci + Camarilla) — the resulting clutter produces so many levels that any price reaction near a level triggers one, making the tool appear to 'always work' while actually providing no discrimination.
- Ignoring the calculation basis — Fibonacci pivots use a different formula than Traditional and produce different levels; switching types mid-chart without understanding the difference leads to inconsistent level quality.